
Figures & data
Figure 1. Schematic diagram of motor and visual space of the target. The dotted rectangle represents the invisible expanded motor space. The solid line rectangle represents the non-expanded visual space. Note. Adapted from ”eye gaze interaction with expanding targets”, by miniotas, D., Špakov, O., and MacKenzie, I. S., 2004, in CHI’04 extended abstracts on human factors in computing systems, p. 1256, (https://doi.Org/10.1145/985921.986037). Reprinted with permission.
Figure 2. Schematic diagrams of (a) visual-space-based highlighting feedback. The dotted line indicates the boundary of motor space, which is not visible to the participants in the experiment. The target visual space would change color (from yellow to red) when the cursor moves into the motor space. (b) target-based highlighting. The dark orange-filled circle indicated the captured target and the fan-shaped activation area (dotted line) was not visible to the participants.
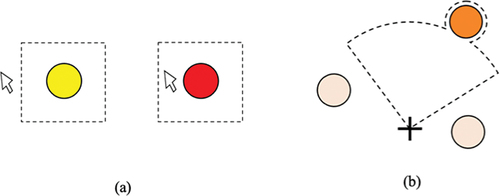
Figure 3. A schematic illustration of the program interface in experiment 1. In the center of the visual display is the start target filled with green (RGB = (0, 255, 0)). Six blue-filled circles ((RGB = (0,0,255)) marked with a number are the goal targets. 39 targets 1, 2, 3, and 4 are located 290 pixels away from the center of the start target, while targets 5 and 6 are located 470 pixels away. The diameter of the target is 20 pixels (visual angle: 0.54°*0.54°). The remaining filled circles were interference targets with the same size and color as the goal targets. The dotted square with a side length of 90 pixels (visual angle: 2.43° * 2.43°) around the target indicates the expanded motor space of the target in the expansion condition. (note. The dotted square and numbers in the circle were not visible in the experiment).
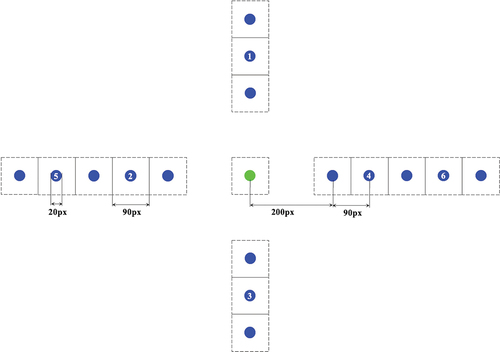
Figure 4. Illustration of one trial in gaze-based control mode with the target’s motor space expanded. a) participants had to select the start target to initiate one trial and start the time recording. One of the goal targets would change from an initial blue to green. b) participants could move the gaze-controlled cursor into the target motor space (invisible dotted square). Once the cursor entered the motor space, the target visual space changed to red (RGB = (255,0,0)). c) participants could click the left mouse to finish this trial, and the program stopped recording time simultaneously.
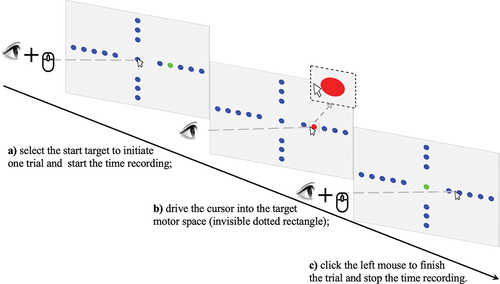
Figure 5. The geometry of selecting a horizontal right target. ”s” represents the center of the start target; ”g” represents the center of the goal target; ”c” represents the endpoint where participants make a left-mouse click. ”Ae” represents the distance between the start target center and endpoint click position; ”dx” represents the endpoint distance to the target center along the axis of the pointing direction.
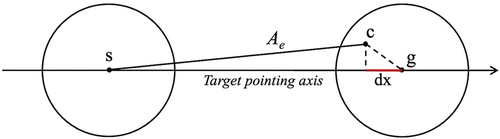
Table 1. Results of six DVs under four conditions (M ± SD) in experiment 1.
Figure 6. Boxplots of (a) Accuracy, (b) Speed, and (c) Throughput in gaze or hand-controlled conditions with motor space expanded or non-expanded (experiment 1). ***, p < 0.001; **, p < 0.01; *, p < 0.05; ns, not significant.
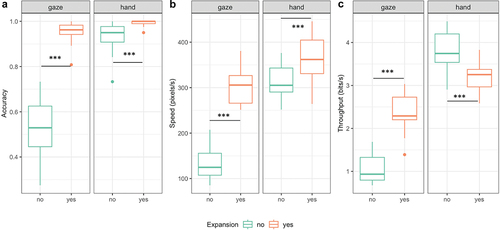
Figure 7. Boxplots of (a) Endpoint distance and (b) Variation in gaze or hand-controlled conditions with motor space expanded or non-expanded (experiment 1). ***, p < 0.001; **, p < 0.01; *, p < 0.05; ns, not significant.
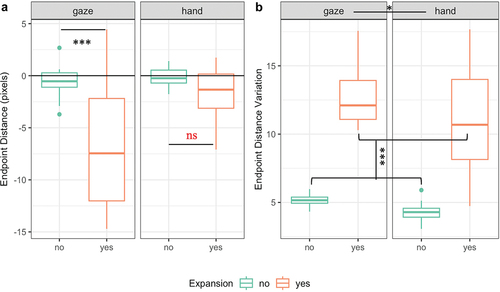
Figure 8. Mental workload profiles in gaze or hand-controlled conditions with motor space expanded or non-expanded (experiment 1). Bars with solid black borders indicate that the corresponding dimension had a significant interaction effect. Bars with dotted borders indicate that the corresponding dimension had a significant main effect. ***, p < 0.001; **, p < 0.01; *, p < 0.05; ns, not significant.
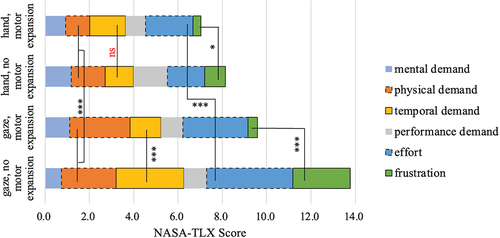
Figure 9. Each goal target (labeled with numbers) has four disturbance targets. ‘MS’ is an abbreviation of motor space with three levels: 30, 60, and 90 pixels; ‘VS’ is an abbreviation of visual space (screen target size) with three levels: 10, 20, and 30 pixels. Other display parameters were identical to that in experiment 1.
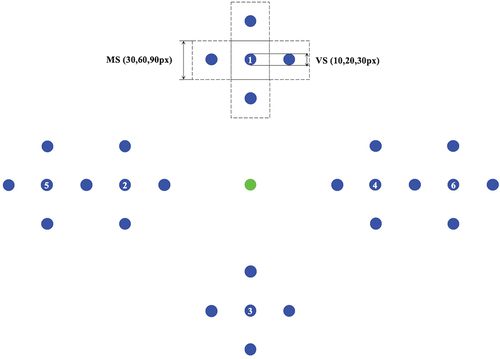
Table 2. Results of six DVs under nine conditions (M±SD) in experiment 2.
Figure 10. Boxplots of (a) Accuracy, (b) Speed, and (c) Throughput with three motor-space sizes under three visual-space sizes (experiment 2). ***, p < 0.001; **, p < 0.01; *, p < 0.05; ns, not significant.
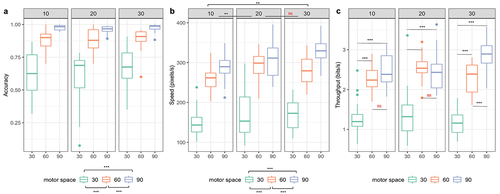
Figure 11. Boxplots of (a) Endpoint distance and (b) Variation with three motor-space sizes under three visual-space sizes (experiment 2). ***, p < 0.001; **, p < 0.01; *, p < 0.05; ns, not significant.
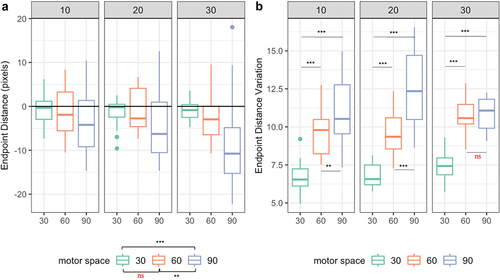
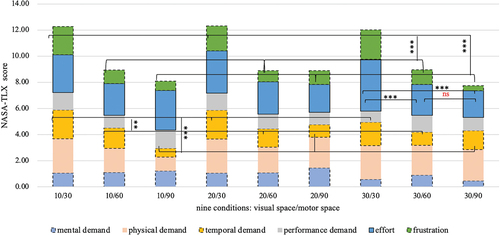
Figure 12. Mental workload profiles with three motor-space sizes under three visual space sizes (experiment 2). Bars with solid black borders indicate that the corresponding dimension had a significant interaction effect. Bars with dotted borders indicate that the corresponding dimension had a significant main effect. ***, p < 0.001; **, p < 0.01; *, p < 0.05; ns, not significant.
Data availability statement
The data that support the findings of this study are available upon reasonable request: a written request can be submitted to investigator, Qi-jun Wang ([email protected]).