Figures & data
Figure 1. Analysis sample: a polyimide (PI) sheet bonded to the curved surface of an acrylic component with a PSA sheet.
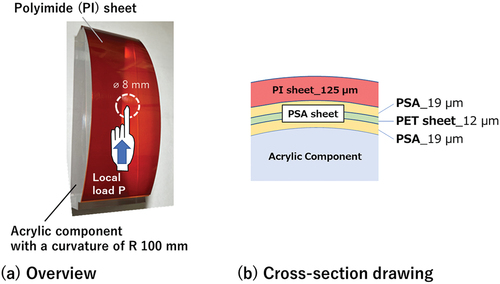
Figure 2. Load tester fabricated to apply a local load to the sample in which a PI sheet is adhesively bonded on the curved acrylic component.
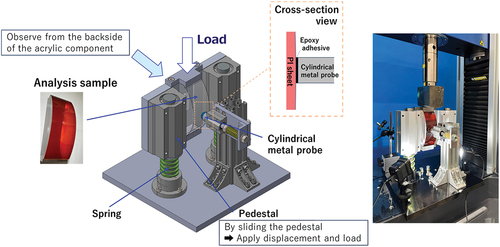
Figure 3. Plastic property of the PI sheet obtained from the tensile test with the dumbbell-shaped specimen.
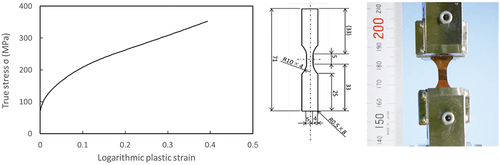
Figure 4. Generalized Maxwell model representing the viscoelasticity of the PSA used in this study.
Figure 5. Schematic of the nanoindentation measurement of the PSA.
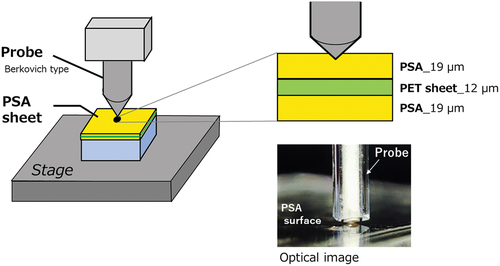
Figure 6. Viscoelastic analysis results of the PSA: (a) master curve E(ω), (b) relaxation modulus E(t), and (c) coefficients of Ei and τi in the prony series.
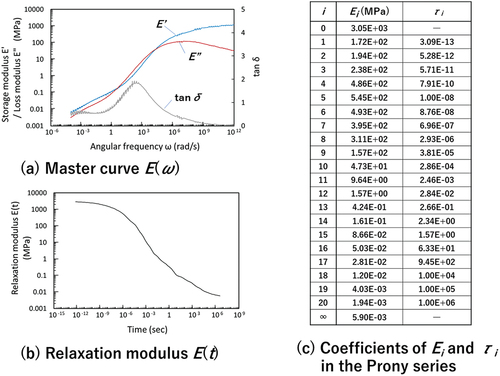
Figure 7. Schematic of the specimens for mechanical tests required to derive cohesive zone model (CZM) parameters.
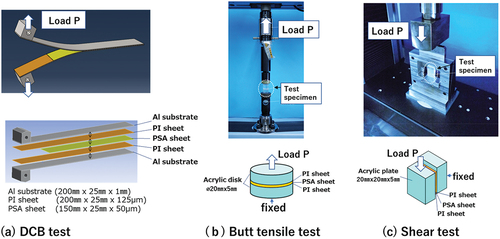
Figure 8. Relationship between the displacement and load obtained from the shear test shown in figure 7 (c), compared with the simulation results obtained for different values of GIIC.
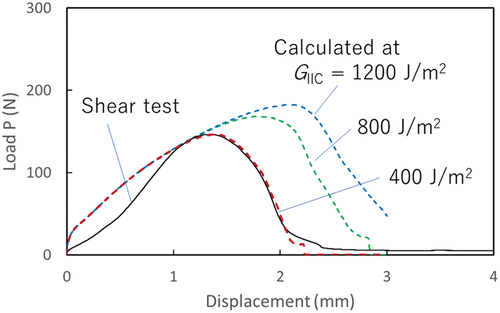
Table 1. Analysis results of the fracture energy and σmax in modes 1 and 2 obtained in this study.
Figure 9. (a) Overview of the simulation model. Enlarged view from (b) Direction A and (c) Direction B.
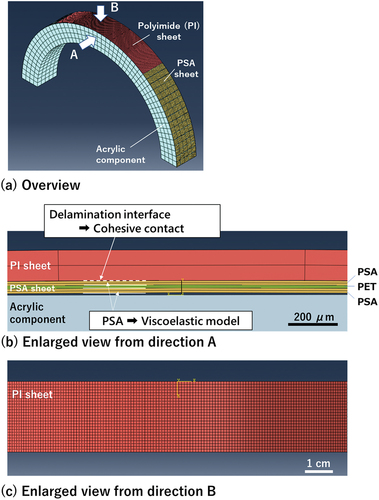
Figure 10. Traction separation law of the cohesive zone model used in this study.
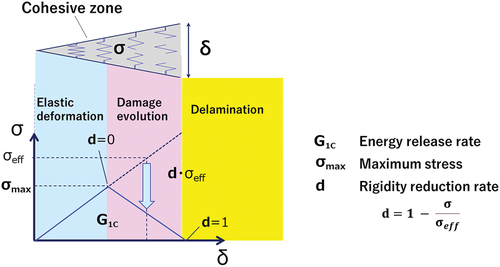
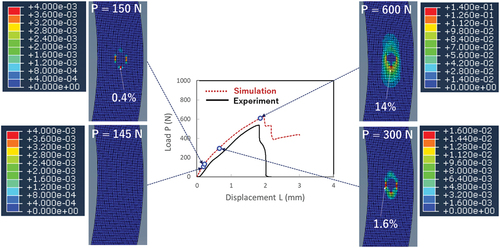
Figure 11. (a) Relationship between the displacement and load when the local load was applied to the local area of the PI sheet surface. (b) Simulation results of the stress distribution. (c) Optical image of the bonding interface. (d) Rigidity reduction rate of the bonding interface.
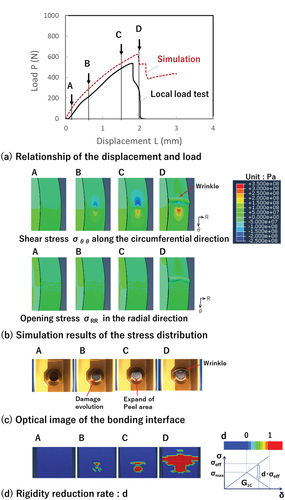
Table 2. Starting loads with the damage evolution and the delamination occurring at the bonding interface, as extracted from the simulation and test results.
Figure 12. Simulation results of the plastic strain distribution of the PI sheet.