
Figures & data
Figure 1. Reference datums/surfaces for land and sea in relation to each other: ocean’s time-mean dynamic topography (MDT), mean sea level (MSL; at the tide gauge) or mean sea surface (MSS; in the open ocean), lowest astronomical tide (LAT), tide gauge zero (TGZ), chart datum (CD), ellipsoidal height (), geoid-ellipsoid separation (N) and physical height (H) on the land vertical datum. Note that
on land, and
over the ocean.
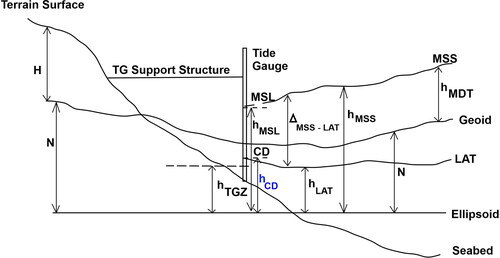
Figure 2. Locations of 10 WADoT tide gauges, 16 PPA tide gauges and 116 AHO tide gauges. The boxes (red in the online version) on the main plot at Ashburton, Dampier and Port Hedland relate to the inset boxes in the bottom row, showing the PPA tide gauges at these locations (numbered as per ).
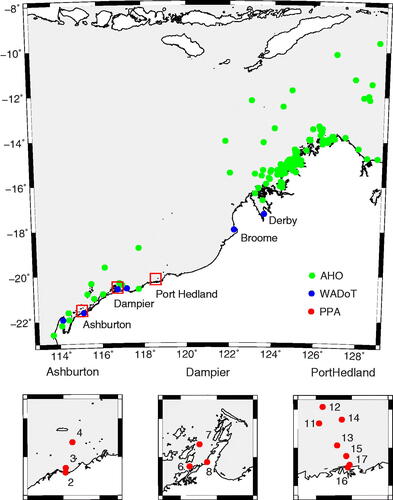
Figure 3. Summary of 10 WADoT and 16 PPA tide gauge observations for the WA study area. The circle size increases with more observations for a given year (e.g. due to an increase in sample rate). Missing circles are where there are no observations – small circles may represent some data missing and/or a lower sampling rate for the given year. Locations for these sites are shown in .
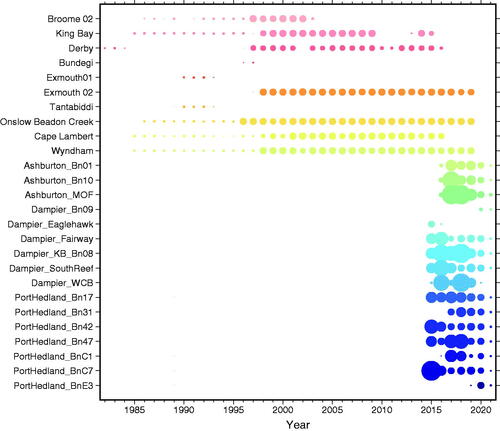
Table 2. Details of the different models tested in this study to provide modelled to compare with tide gauge
at the coast.
Table 1. Final 25 tide gauges used in this study for analysis. The tide gauges are ordered from west to east.
Table 3. Treatment of corrections and transformations for models and observations.
Figure 4. The difference between tide gauge and
derived from geoid(N)+MDT and MSS models at 25 tide gauges. The modelled MSS in the differences are shown in the legend on the figure. The tide gauges are ordered from west to east, as listed in and shown in . Descriptive statistics are shown in .
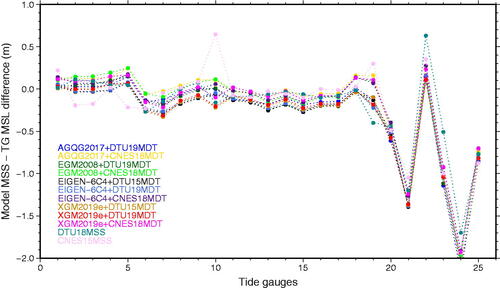
Table 4. Descriptive statistics for differences between model from a range of N + MDT and MSS models and
at tide gauges.
Figure 5. Comparison of derived from geoid(N)+MDT and MSS derived
at 25 tide gauges.
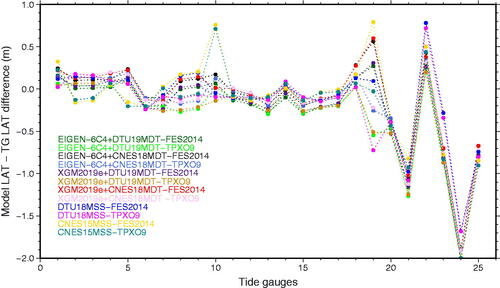
Table 5. Descriptive statistics for which is the difference between
computed from models, and hLAT computed from tide gauge records at the tide gauge location.
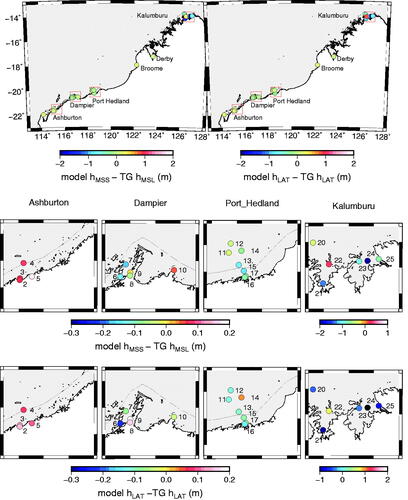
Figure 6. Top left is the difference between computed at 25 tide gauges from EIGEN-6C4(N)+CNES18MDT and
computed from the tide gauge record. Top right is the difference between
computed from DTU18MSS and FES2014b(LAT) and
computed from the tide gauge record. The middle row shows enlargements for the four clusters of tide gauges (shown in boxes (red in the online version) in the top row plots) for model
minus tide gauge computed
(as per top left), with the bottom row showing those same enlargements with model
minus tide gauge computed
(as per top right). The offshore dotted grey line in the inset boxes indicates the ∼10 km distance offshore adopted as the limit of reliable altimetry observations. Note the larger scale range for the enlargements on the right of rows 1 and 2 (Kalumburu) indicating the much larger differences for the northern-most AHO tide gauges.
Data availability statement
Tide gauge data are available from the AHO, WADOT, PPA and BOM on request. AGQG2017 is available from Sten Claessens (Curtin University) on request. All other models are available as per the URL in , or by contacting the developers.