
Figures & data
Figure 1. Spatial distribution of the surveyed stands within the study landscape situated in boreal Sweden. Background map from The Swedish Land Survey (Lantmäteriet).
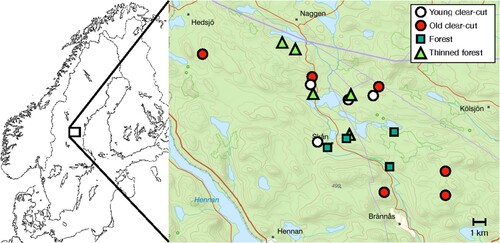
Table 1. The number of sampled CWD objects grouped by stand type and tree species.
Figure 2. Total beta diversity (abundance-based) of beetle communities collected from four dead wood types: high-stumps on clearcuts, clearcut stumps, forest snags and forest stumps. A – compositional differences illustrated by PCoA; B – beta diversity measured as distance to centroid in each dead wood type; median values (black line), 25th and 75th percentile (boxes), and minimum/maximum values (whiskers) are shown. Beta diversity ( = distance to centroid) differed significantly between dead wood types (ANOVA: F = 8.97, p = 0.004).
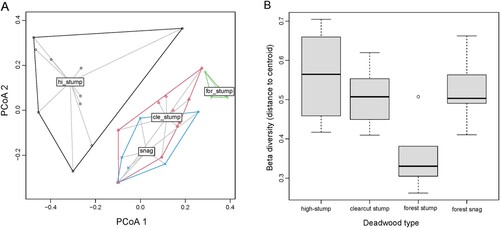
Table 2. Results from ANOVA, comparing beta diversity between beetle assemblages in different dead wood types, and among different tree species.
Figure 3. Total beta diversity (presence-absence-based) of beetle communities collected from three tree species: spruce, pine and birch. A – compositional differences illustrated by PCoA; B – beta diversity measured as distance to centroid in each dead wood type; median values (black line), 25th and 75th percentile (boxes), and minimum/maximum values (whiskers) are shown. Beta diversity ( = distance to centroid) did not differed significantly between tree species (ANOVA: F = 1.11, p = 0.35).
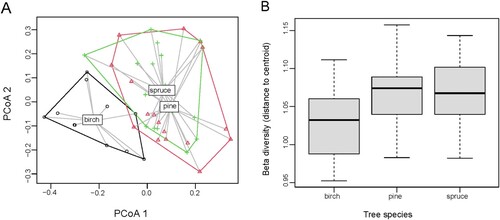
Table 3. Structure and results of the final models, GLM/GLMER (negative binomial), explaining abundance of the most common species* per deadwood (CWD) substrate (Table S4).
Supplemental Material
Download Zip (150.2 KB)Data availability statement
The original data supporting the findings of this manuscript is included as a supplemental data sheet.