482
Views
0
CrossRef citations to date
0
Altmetric
Research Article

The extended project qualification in England: does it provide good preparation for higher education?

ORCID Icon

Figures & data

Table 1. Number of students in KS5 cohort, split by school type, EPQ, and inclusion in regression models or not.

Table 2. EPQ and non-EPQ students progressing to HE.

Table 3. Students progressing to HE, by EPQ grade.

Table 4. Results of regression models, predicting the probability of progressing to HE.

Figure 1. Predicted probabilities of progressing to HE by EPQ, and KS5 mean points score.

Figure 1. Predicted probabilities of progressing to HE by EPQ, and KS5 mean points score.

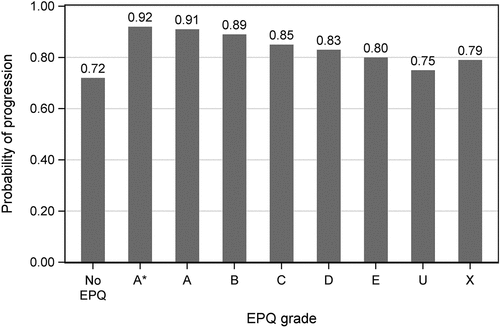
Figure 2. Predicted probabilities of progressing to HE by EPQ grade.

Figure 2. Predicted probabilities of progressing to HE by EPQ grade.

Table 5. EPQ and non-EPQ students dropping out, by year started HE.

Table 6. Drop-out rate by EPQ grade (year 1).

Table 7. Results of regression models, predicting the probability of drop-out from HE in year 1.

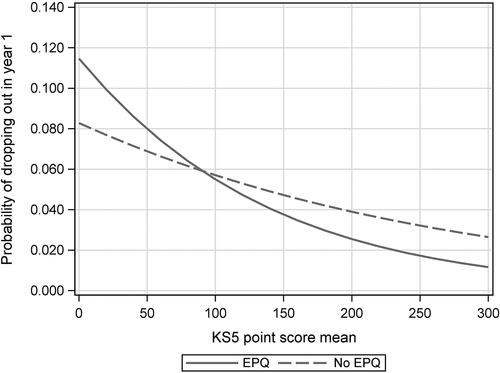
Figure 3. Predicted probabilities of drop-out in year 1 by EPQ, and KS5 mean points score.

Figure 3. Predicted probabilities of drop-out in year 1 by EPQ, and KS5 mean points score.

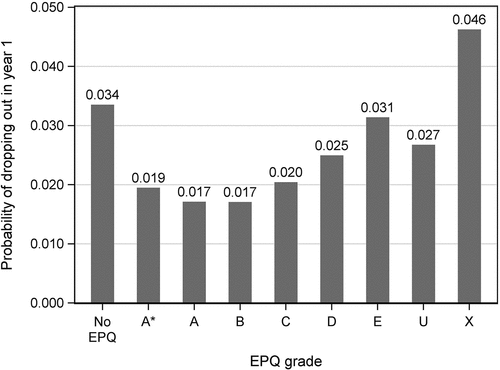
Figure 4. Predicted probabilities of drop-out in year 1 by EPQ grade.

Figure 4. Predicted probabilities of drop-out in year 1 by EPQ grade.

Table 8. Degree class distribution for EPQ and non-EPQ students.

Table 9. Achieving a first, by EPQ grade.

Table 10. Results of regressions models, predicting the probability of achieving a first and at least an upper second-class degree.

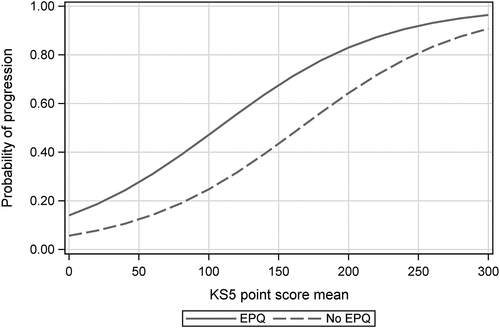
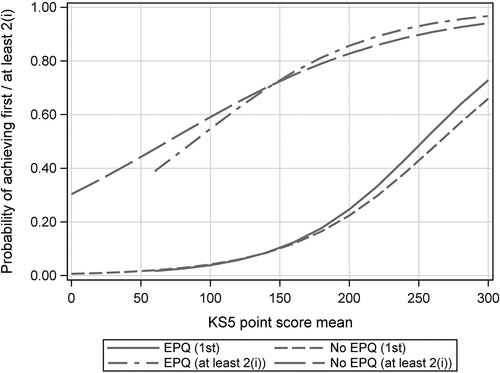
Figure 5. Predicted probabilities of achieving a first or at least an upper second by EPQ, and KS5 points score.

Figure 5. Predicted probabilities of achieving a first or at least an upper second by EPQ, and KS5 points score.

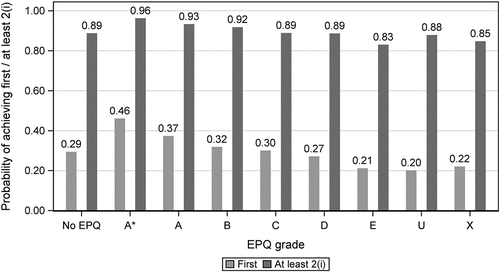
Figure 6. Predicted probabilities of achieving a 1st and at least a 2(i) by EPQ grade.

Figure 6. Predicted probabilities of achieving a 1st and at least a 2(i) by EPQ grade.