
Figures & data
Figure 1. The hypothetical nature of the snowline at finer spatial resolutions. Complex snow edges at the snow-tone stop easy definition and measurement of the snowline. A standardized snowline position is therefore necessary.
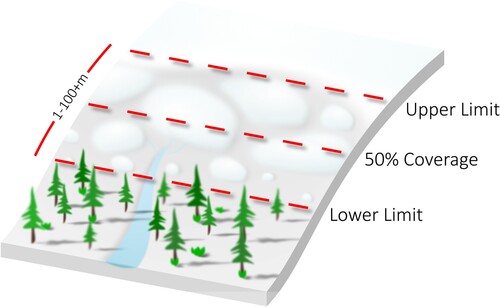
Figure 2. Map of Canadian and Norwegian transects (red). High altitude climate stations in italics in the Western Norway pane. Map data from Open Street Map, © OpenStreetMap contributors CC BY-SA 2.0.
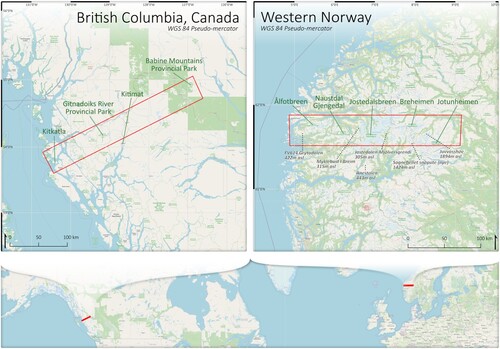
Figure 3. Method to determine the end-of-the-ablation season illustrated using example seNorge observed snow depths from high altitude climate stations in the Norwegian transect.
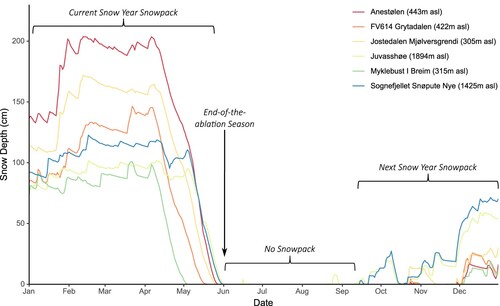
Figure 4. Stepwise procedure used by the snow-edge algorithm.
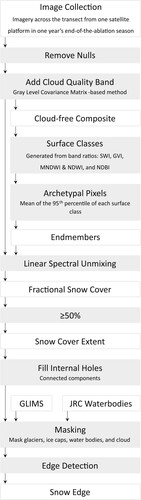
Figure 5. (a) End-of-ablation season dates from 1981 to 2021 for the Norwegian transect. Grey box represents July. Red points are used for years with no recovered Landsat data during 8–23 July. (b) Landsat image densities for each year’s 16-day window after 8th July.
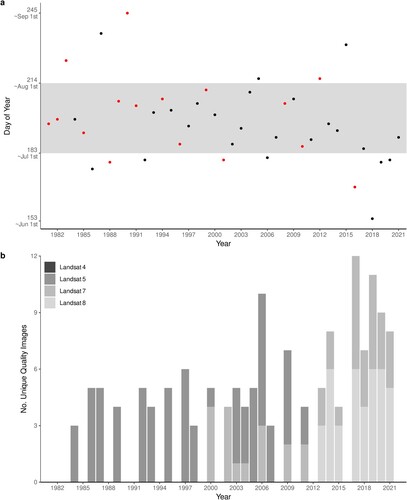
Figure 6. Example plot from 2017 (Landsat 7/8) depicting snow-edge altitude against distance from the Western Norwegian coast (coloured points). Densities derived from neighbourhood kernel. Snowline altitude prediction from OLS regression (solid line) (adj.r2(601031) = 0.58, p<.005) with uncertainty (dashed) calculated from 95th and 5th percentiles of mean snow-edge altitudes across 2° aspect bins. Data are accompanied by snowline altitude observations reported by Ahlmann (Citation1922) (cross).
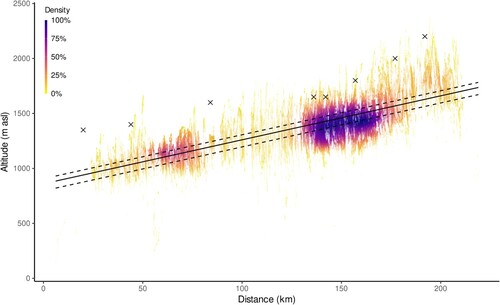
Figure 7. Mean daily sea-level-temperature, snowfall, and surface solar downwelling radiation for each meteorological season in the 2018 snow year against distance. Error bars indicate SEM. Confidence intervals at 95%. Due to the latitudinal resolution of the ERA5-land Climate Reanalysis, climate data were extracted from multiple latitudinal grid rows within the transect. This produced multiple separate spatial curves for each season of each climate variable as is particularly visible for snowfall.
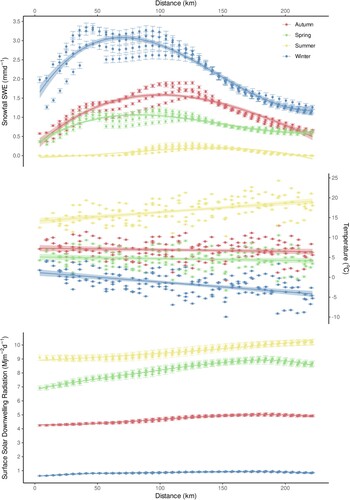
Figure 8. Regional snowline altitudes for the Norwegian transect between 1984 and 2021. OLS regression (adj.r2(24) = −0.003, p = .347; Kendall’s τ(9998) = 0.194, p = .158) (black) is accompanied by 95% confidence intervals (grey). Error bars constructed from the aspect uncertainty of each yearly snowline altitude prediction.
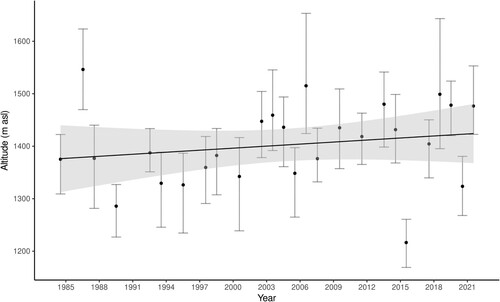
Figure 9. Mean daily sea-level-temperature, snowfall, snowmelt, and surface solar downwelling radiation values for meteorological seasons between 1981 and 2021. Confidence intervals at 95%.
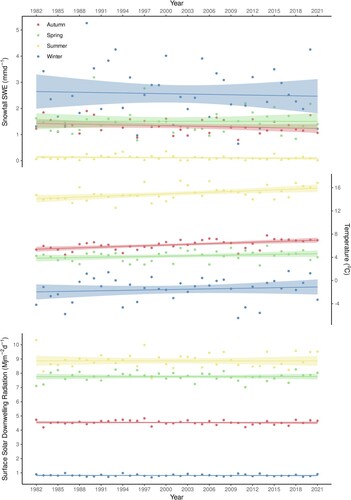
Figure 10. Snowline altitude gradients for the Norwegian transect between 1984 and 2021. Error bars produced from the 95% confidence interval of regressions from 10,000 bootstrap samples. OLS regression (adj.r2(24) = 0.064, p = .114; Kendall’s τ(9998) = −0.194, p = .044) is accompanied by 95% confidence intervals.
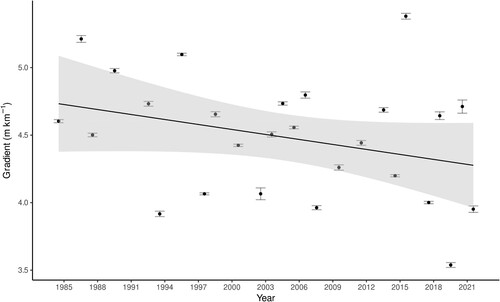
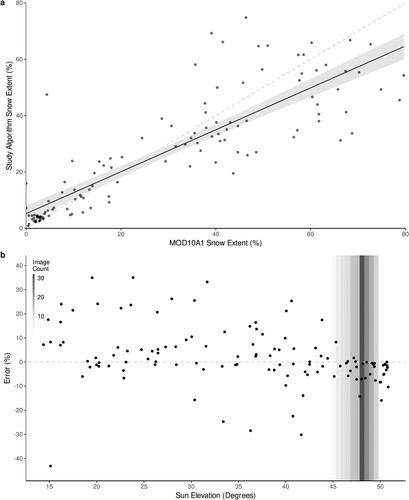
Figure 11. (a) The study algorithm derived snow extent percentage against MOD10A1. OLS regression (solid) (adj.r2(120) = 0.74, p<.005) and 95% confidence intervals (grey). Dashed line indicates 1:1 line. (b) Errors of percentage snow extent for the study algorithm against the MOD10A1 algorithm for each validation image by sun elevation. Dashed line indicates 0% difference. Bars indicate the number of Norwegian transect images present by sun elevation.
Supplemental Material
Download PDF (1 MB)Data availability statement
This study contains modified Copernicus Climate Change Service Information 2022. Neither the European Commission nor ECMWF is responsible. All code is openly available through: https://github.com/lauriequincey/snowlines. An openly available Google Earth Engine web-app running the snowline algorithm and climate explorer allows anyone to reproduce the spatial-aspect of our study for global mountain regions via a graphical user interface. It is available at: https://lauriequincey.users.earthengine.app/view/snowlines.