Figures & data
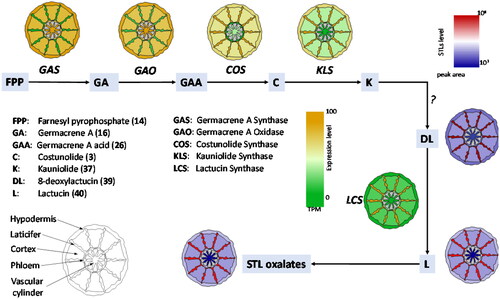
Figure 1. Sesquiterpene Lactones (A) Stereochemistry of α-methylene-γ-lactone sesquiterpene lactones, (1a) 6,7 cis lactone, (1b) 6,7 trans lactone, (2a) 7,8 cis lactone (2b) 7,8 trans lactone. (B) Examples for sesquiterpene lactone backbones of increasing complexity levels as defined by Seaman, (Citation1982). (3) germacranolide (here: costunolide), (4) guaianolide, (5) xanthanolide, (6) 3,4-secoambrosanolide. (C) Examples for chemical STL diversity found in nature: (7) argophyllin B, (8) dehydrocostus lactone, (9) lactucopicrin, (10) thapsigargin, (11) 8-epi-xanthatin, (12) tomentosin, (13) 2α-acetoxy-inuviscolide. Ac: acetate, Ang: angelate.
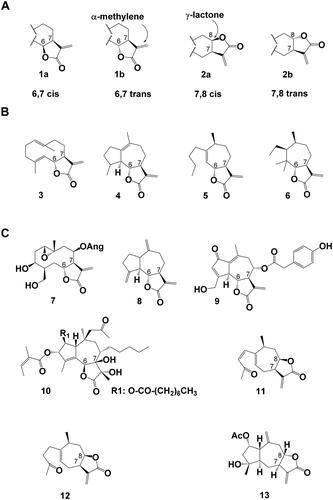
Figure 2. Phylogeny of cytochrome P450 enzymes (CYPs) that oxidize sesquiterpenes. Neighbour-joining tree with 500 bootstraps, outgroup: AaC4H, subfamilies with CYPs oxidizing sesquiterpenes but not involved in STL biosynthesis are colored grey. CYP subfamilies involved in STL biosynthesis are shown in green (CYP71AV), yellow (CYP71BZ), orange (CYP71BL), red (CYP71CB and AX), purple (CYP71CA and DD) and blue (CYP76AE). The positions of the oxidized carbons of the substrate are indicated by a red asterisk. (38): R1=R2=H, (40): R1=O, R2=OH.
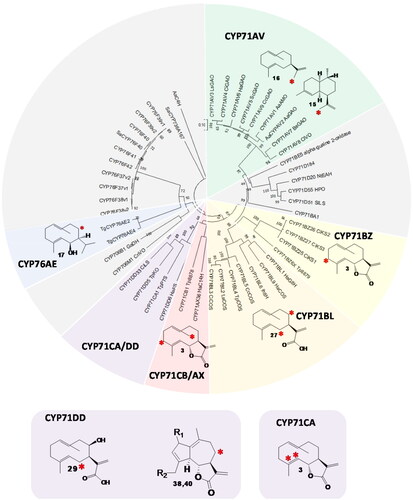
Figure 3. Sesquiterpene synthase reactions and artemisinin biosynthesis. (A) Sesquiterpene synthase reactions involved in STL biosynthesis pathways leading from farnesyl pyrophosphate (FPP, (14)), to amorphadiene (15), germacrene A (16) and kunzeaol (17). (B) Artemisinin biosynthesis from amorphadiene (15) via artemisinic aldehyde (19) to artemisinin (23) with the side product artemisinic acid (20).
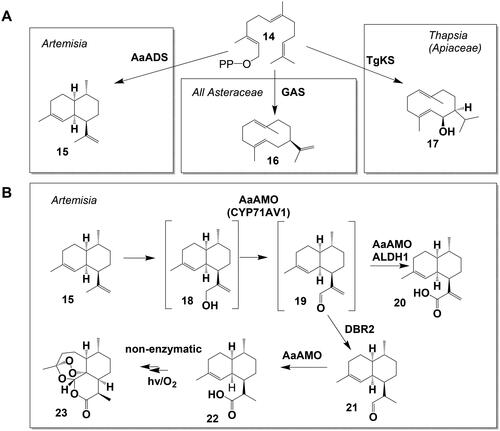
Table 1. CYP enzymes involved in STL biosynthesis.
Table 2. STL in major subfamilies of the Asteraceae family and two outgroup families.
Table 3. STL in major tribes of the Asteroideae subfamily.
Figure 4. Lactonization reactions in Asteraceae STL. (A) Conversion of germacrene A (16) to germacrene A acid (26). (B) Lactonization of germacrene A acid (26) to the STL inunolide (29), eupatolide (30), epi-inunolide (32) and costunolide (3).
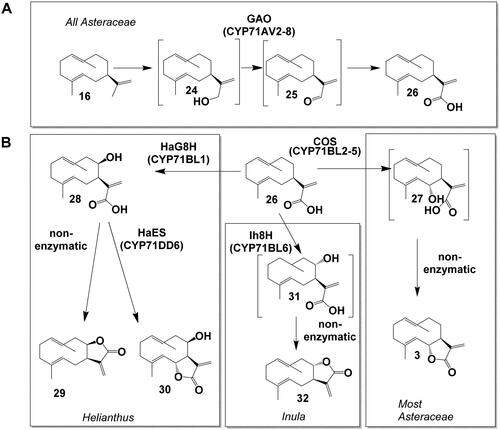
Figure 5. Biosynthesis pathways downstream costunolide in Asteraceae and STL biosynthesis in Apiaceae. (A) Conversion of costunolide (3) to 14-hydroxycostunolide (33) and 3β-hydroxycostunolide (35) (via hydroxylation), to parthenolide (34) (via epoxidation) and kauniolide (37) (via backbone rearrangement). (B) Oxidation of kauniolide (37) to lactucin (40). C Conversion of kunzeaol (17) to epi-dihydrocostunolide (41).
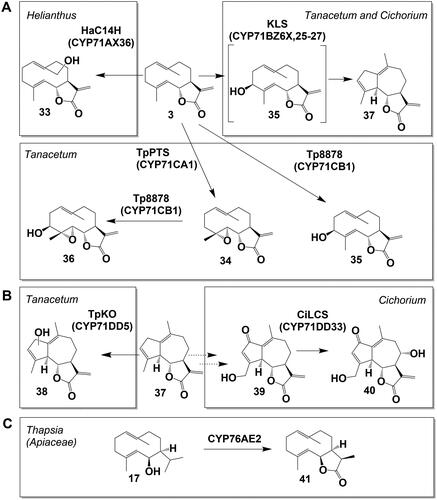
Figure 6. Helianthus annuus (sunflower) as a model for the developmental regulation of sesquiterpene lactone (STL) biosynthesis in (biseriate) capitate glandular trichomes (CGT) of Asteraceae. Scheme of CGT in (A) pre-secretory and (B) in secretory stage, respectively. Fully developed trichomes consist of 5-6 biseriate layers of stalk cells and 2 layers of secretory cells. STL are sequestered between cell wall and cuticle of secretory cells forming an extracellular glandular globe. (C) Scheme of (I) disk floret development in the capitulum. (II) Development of CGT on anthers, (III) biosynthetic STL gene expression (yellow/green gradient) in secretory cells and (IV) STL accumulation (red/blue gradient) in the glandular globe are tightly co-regulated. When the outermost disk floret opens, CGTs of the outer half of disk floret rows are already in the post-secretory stage while the innermost disk florets are still in the pre-secretory stage. (Göpfert et al. Citation2005, Citation2009). Note: The scheme of a glandular trichome in is modified from Spring et al. (Citation2020), The scheme of the cross section of a capitulum (flower head) in is modified from Göpfert et al. (Citation2005). Both original figures were published under the Creative Commons Attribution License.
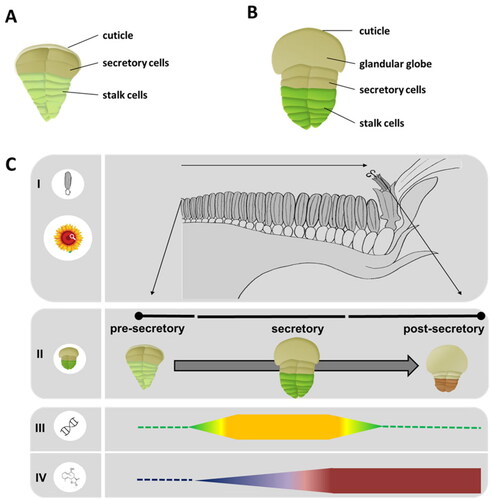
Figure 7. Schematic representation of the spatial distribution of gene expression (yellow/green gradient map) and STL accumulation (red/blue gradient map) over a schematic root structure from chicory based on data of previous publications (Bogdanović et al., Citation2019; Cankar et al., Citation2022; Citation2023; Vahabi et al., Citation2024). Genes involved in early steps of STL biosynthesis are expressed outside of the laticifers. Downstream of costunolide the expression pattern of STL biosynthesis genes is higher in the latex relative to other tissues (yellow/green gradient map). The accumulation of STLs is higher in the laticifers (red/blue gradient map) than in the other root tissues.