
Figures & data
Table 1. Concentrations of organic pollutants in hydrolysate and yeast samples (mean ± standard deviation, n = 3). Concentrations are reported as the total sum of single compounds quantified in the sample.
Table 2. Heavy metal concentration (mg kg−1 or mg L−1) in hydrolysate and in yeast biomass compared with maximum levels for contaminants in foodstuffs by EU legislation (EU leg.), European Food Safety Authority (EFSA) and FAO & WHO.
Table 3. Composition of control and experimental yeast feeds (% of dry matter) for fish in duplicates. Table from Brunel et al. (Citation2022), under Creative Commons Attribution License CC BY 4.0. ‘Vitamin mix’ and ‘Mineral mix’ ingredients were provided by NOFIMA (Norway) and ‘Astaxanthin & vitamin mix’ ingredients were provided by Aller Aqua A/S (Denmark). Further details on vitamin and mineral mixes composition can be found as supplementary materials, Table S4.
Table 4a. Total fat content and fatty acid profile (%) of fish fillet from Arctic char fed with yeast biomass (experimental fish group). Data from Jacobsson (Citation2022) and Brunel et al. (Citation2022) under open access or under Creative Commons Attribution License CC BY 4.0. Data are presented as the mean ± standard deviation, with n sample size per group of fish.
Table 4b. Total fat content and fatty acid profile (%) of fish fillet from Arctic char fed with vegetable oil ingredients (control fish group). Data from Jacobsson (Citation2022) and Brunel et al. (Citation2022) under open access or under Creative Commons Attribution License CC BY 4.0. Data are presented as the mean ± standard deviation, with n sample size per group of fish.
Figure 1. 7-ethoxyresorufin-O-deethylase activity in hepatic microsomes of Arctic char fish after the feeding trial. Enzyme activity is presented as pmol min−1 mg−1 of microsomal protein (mean ± standard error, n = 16 per group).
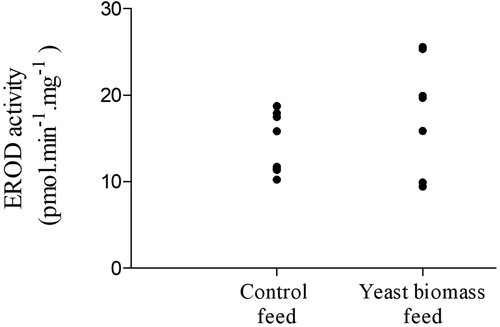
Table 5. Sensory analysis of fish fillets on untrained volunteers (p < 0.05).Footnote1
Supplementary_material_Biomass_sensory_Brunel
Download PDF (143.9 KB)Data availability statement
The data supporting the findings of the study are available from the corresponding author upon reasonable request.