534
Views
0
CrossRef citations to date
0
Altmetric
Research Article

Impact of biochar and organic fertilizers on sweet potato yield, quality, ascorbic acid, β-carotene, sugars, and phenols contents

ORCID Icon
Received 15 Nov 2023, Accepted 09 Feb 2024, Published online: 23 Feb 2024

Figures & data

Figure 1. Overall average of sweet potato root weight of plants grown under six soil management practices (Cow = cow manure, SS = sewage sludge, Control = no-mulch native soil, Bio = biochar, Vermi = vermicompost, and CM = chicken manure). Each bare is an average of 6 replicates ± standard error. Values in each treatment accompanied by the same letter(s) are not significantly different (p≥ 0.05) using Duncan’s multiple range test (SAS Institute Inc Citation2016).
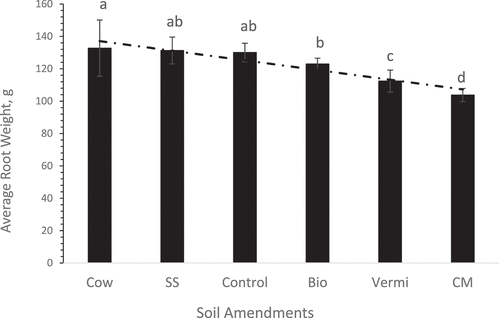
Figure 1. Overall average of sweet potato root weight of plants grown under six soil management practices (Cow = cow manure, SS = sewage sludge, Control = no-mulch native soil, Bio = biochar, Vermi = vermicompost, and CM = chicken manure). Each bare is an average of 6 replicates ± standard error. Values in each treatment accompanied by the same letter(s) are not significantly different (p≥ 0.05) using Duncan’s multiple range test (SAS Institute Inc Citation2016).
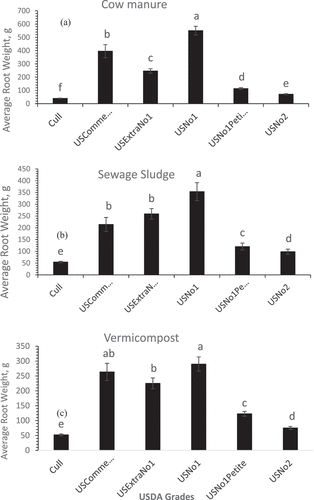
Table 1. Average number of sweet potato roots categorized according to the USDA standard grades of plants grown under each soil treatment.

Figure 2. Overall sweet potatoes average root weight of each USDA standard grade, regardless of soil treatment. Each bare is an average of three replicates ± standard error. Values in each grade accompanied by the same letter(s) are not significantly different (p≥ 0.05) using Duncan’s multiple range test (SAS Institute Inc Citation2016).

Figure 2. Overall sweet potatoes average root weight of each USDA standard grade, regardless of soil treatment. Each bare is an average of three replicates ± standard error. Values in each grade accompanied by the same letter(s) are not significantly different (p≥ 0.05) using Duncan’s multiple range test (SAS Institute Inc Citation2016).

Figure 3. Overall sweet potatoes average root weight of each USDA standard grade, regardless of soil treatment. Each bare is an average of three replicates ± standard error. Values in each grade accompanied by the same letter(s) are not significantly different (p ≥ 0.05) using Duncan’s multiple range test (SAS Institute Inc Citation2016).
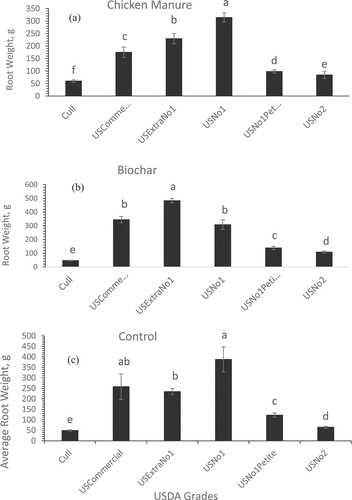
Figure 3. Overall sweet potatoes average root weight of each USDA standard grade, regardless of soil treatment. Each bare is an average of three replicates ± standard error. Values in each grade accompanied by the same letter(s) are not significantly different (p ≥ 0.05) using Duncan’s multiple range test (SAS Institute Inc Citation2016).
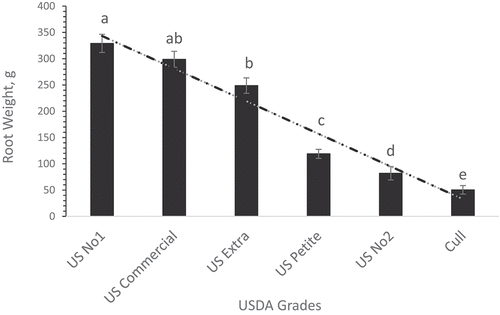
Figure 4. Overall sweet potato root standard USDA grades of plants grown under field conditions regardless of soil treatments. Each bare is an average of three replicates ± standard error. Values in each grade accompanied by the same letter(s) are not significantly different (p ≥ 0.05) using Duncan’s multiple range test (SAS Institute Inc Citation2016).

Figure 4. Overall sweet potato root standard USDA grades of plants grown under field conditions regardless of soil treatments. Each bare is an average of three replicates ± standard error. Values in each grade accompanied by the same letter(s) are not significantly different (p ≥ 0.05) using Duncan’s multiple range test (SAS Institute Inc Citation2016).

Figure 5. Concentrations of ascorbic acid (a) and β-carotene (b) ± std. error in sweet potato roots of plants grown under six soil management practices (chicken manure, CM; cow manure cow, vermicompost vermi, biochar bio, sewage sludge SS, and no mulch control treatment. Statistical comparisons were performed among six treatments. Bars associated with the same letter(s) are not significantly different (p ≥ 0.05) using Duncan’s multiple range test.
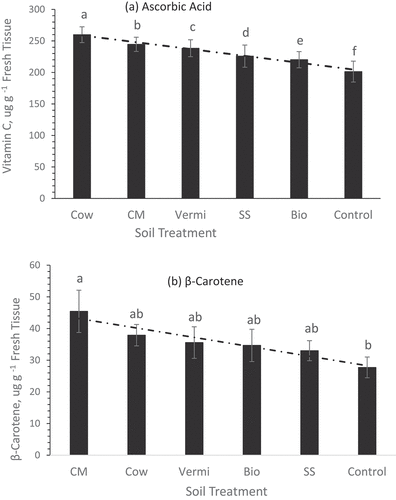
Figure 5. Concentrations of ascorbic acid (a) and β-carotene (b) ± std. error in sweet potato roots of plants grown under six soil management practices (chicken manure, CM; cow manure cow, vermicompost vermi, biochar bio, sewage sludge SS, and no mulch control treatment. Statistical comparisons were performed among six treatments. Bars associated with the same letter(s) are not significantly different (p ≥ 0.05) using Duncan’s multiple range test.
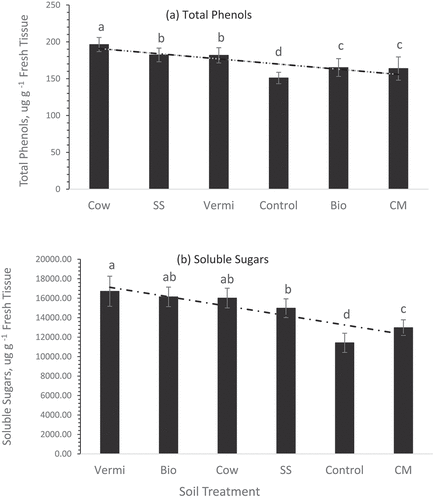
Figure 6. Concentrations of total phenols (a) and soluble sugars ± std. error (b) in sweet potato roots of plants grown under sex soil management practices (chicken manure, CM; cow manure cow, vermicompost vermi, biochar bio, sewage sludge SS, and no mulch NM control. Statistical comparisons were performed among six treatments. Bars associated with the same letter(s) are not significantly different (p ≥ 0.05) using Duncan’s multiple range test.

Figure 6. Concentrations of total phenols (a) and soluble sugars ± std. error (b) in sweet potato roots of plants grown under sex soil management practices (chicken manure, CM; cow manure cow, vermicompost vermi, biochar bio, sewage sludge SS, and no mulch NM control. Statistical comparisons were performed among six treatments. Bars associated with the same letter(s) are not significantly different (p ≥ 0.05) using Duncan’s multiple range test.