Figures & data
Table 1. Evaluation of the certified reference material (CRM) measured by combined ICP-MS and isotope mass balance calculations.
Figure 1. Comparison of analytical methods used to analyse cadmium (Cd) and zinc (Zn) concentrations in wheat samples that contain enriched stable isotopes (67Zn, 111Cd). ‘ICP-MS + calculations’ refers to inductively coupled plasma mass spectroscopy combined with isotope mass balance calculations. ‘OES’ refers to inductively coupled plasma optical emission spectroscopy.
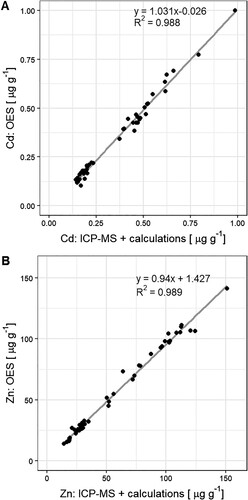
Figure 2. Comparison of analytical methods used to analyse Zn (A, B) and Cd (B, C) concentrations in wheat samples that contain enriched stable isotopes (67Zn, 111Cd). ‘ICP-MS + calc.’ refers to inductively coupled plasma mass spectroscopy combined with isotope mass balance calculations. ‘ICP-MS no calc.’ refers to ICP-MS results with no isotope mass balance correction to correct for isotope ratios at non-natural abundance. Regression line was only plotted when the trend between x and y was significant.
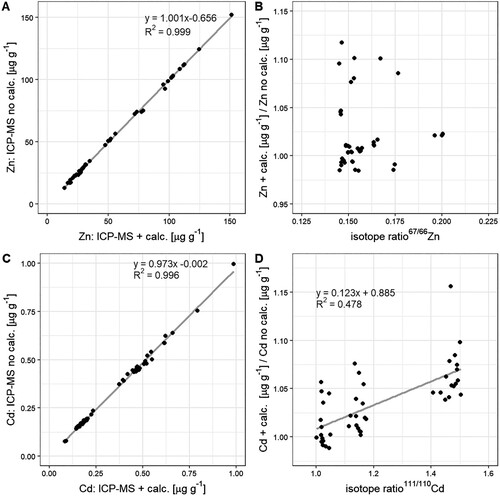
Table 2. Selected soil properties.
Table 3. Wheat harvest data.
Table 4. Zinc (Zn) and cadmium (Cd) concentrations and masses in wheat samples.
Figure 3. Fraction of Zn (A) and Cd (B) in wheat shoots either derived from the soil (brown) or the green manure (green) expressed in percentage. Error bars represent the standard deviation of the mean of n = 4 experimental replicates. Letters denote statistical differences of the mean between Zn or Cd that derived from the soil (brown) and from the green manure (green) determined by a Kruskal–Wallis test (Table S5).
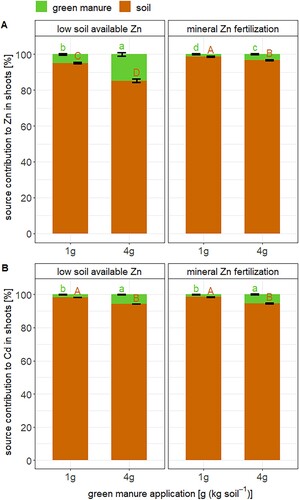
Figure 4. The recovery of Zn (A) and Cd (B) in shoots of wheat that was applied with the green manure (GM). Error bars represent the standard deviation of the mean of n = 4 experimental replicates. Letters denote statistical differences of the mean determined by Kruskal–Wallis test (Table S6).
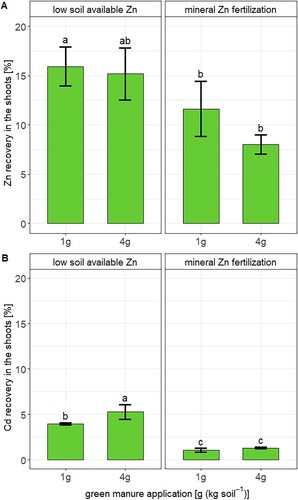
Figure 5. The transfer of Zn (A) and Cd (B) from soil (brown) and green manure (green) to shoots of wheat. Error bars represent the standard deviation of the mean of n = 4 experimental replicates. Horizontal lines (black) express the mean (straight line) and standard deviation (dashed line) of the control soil that has not received green manure. Letters denote statistical differences of the mean of Zn and Cd derived from the soil (brown) and green manure (green) determined by a Kruskal–Wallis test that includes the Zn and Cd derived from the soil in the control treatment (see details Table S7).
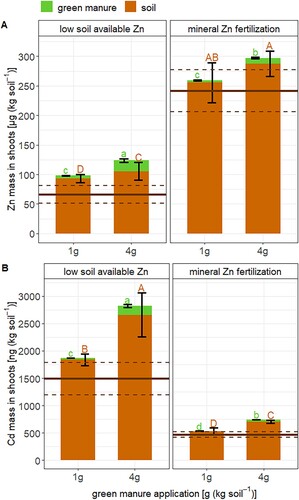
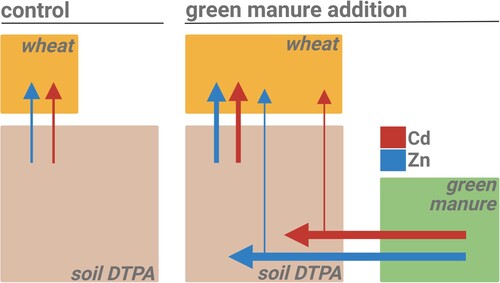
Figure 6. Schematic summary of the major effects of green manure addition on Zn and Cd dynamics in a soil–wheat system (alkaline soil with low Zn availability). Boxes are approximately proportional to the size of the Zn and Cd masses in the DTPA-extractable soil pools, green manure and wheat shoots. Size of the arrows symbolize Zn (blue) and Cd (red) transfer rates between the soil, fertilizer and plant compartments. Left: control treatment with no green manure added, Right: treatment with 4 g green manure per kg of soil. The direct transfer of Zn and Cd from the green manure to the wheat is small, but the transfer from the soil to the wheat significantly increases with green manure.