
Figures & data
Table 1. Characteristics of included studies.
Figure 1. Flow diagram for study retrieval and selection.
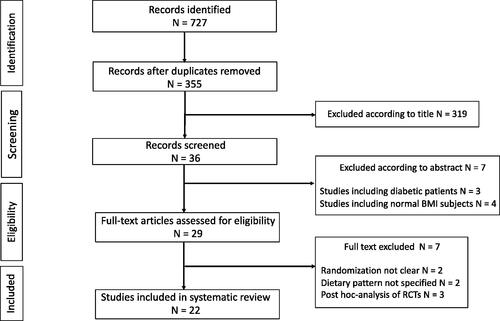
Figure 2. Traffic light plot presenting the risk of bias within the RCTs included in the systematic review.
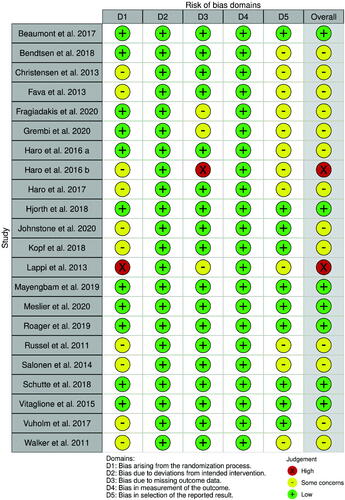
Figure 3. Summary plot presenting the risk of bias within the RCTs included in the systematic review.
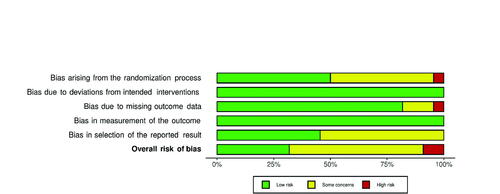
Table 2. Diets compositions of the included studies.
Figure 4. Microbiota main changes in individuals with obesity following classical or healthy dietary regimens in comparison to several control diets. MD: Mediterranean Diet, compared to low-fat high carbohydrate diet in 1Haro et al. (Citation2016a, Citation2016b, Citation2017) and to a habitual western diet in 2Meslier et al. (Citation2020). LFHC: Low-fat high-carbohydrate diet shows changes in comparison to MD (1Haro et al. Citation2016a, Citation2016b, Citation2017; P. diastonis only in the non-MetS group; Streptococcus and Clostridium in MetS-OB) and in microbiome plasticity (3Fragiadakis et al. Citation2020; 4Grembi et al. Citation2020). HFD: High fat diet; F. prausnitzii increased in high saturated fat diet with a high glycemic index as opposed to baseline (5Fava et al. Citation2013). HPD: high protein diet presents variations in Roseburia/Eubacterium rectale as proportion of total bacteria and decreased of Bacteroidetes versus MD (6Russell et al. Citation2011; 7Beaumont et al. Citation2017). *Others: dietary interventions with resistant-starch weight maintenance diet (RS-WM) versus control weight maintenance diet (C-WM diet) (8Johnstone et al. Citation2020); whole grain (WG) and fruits and vegetables (FV) interventions versus baseline (9Kopf et al. Citation2018). WG diet was also studied against refined grain (RG) consumption (10Roager et al. Citation2019; 12Vitaglione et al. Citation2015), with correlation in women (13Vuholm et al. Citation2017); resistant starch (RS) diet, non-starch polysaccharides (NSPs) diet and weight loss (WL) diet versus Run-in maintenance diet (protein/carbohydrate/fat % as 13:52:35 of metabolizable energy) (11Salonen et al. Citation2014, 14 Walker et al. Citation2011). Created with BioRender.com.
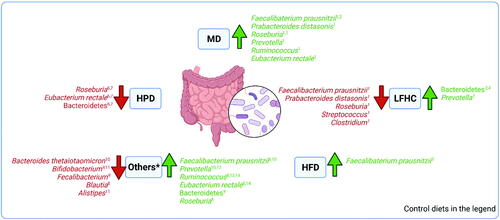
Table 3. Results of the included studies.