
Figures & data
Figure 2. Risk of bias of the included studies. + shows a low risk, - shows a high risk and ? shows unclear risk of bias.
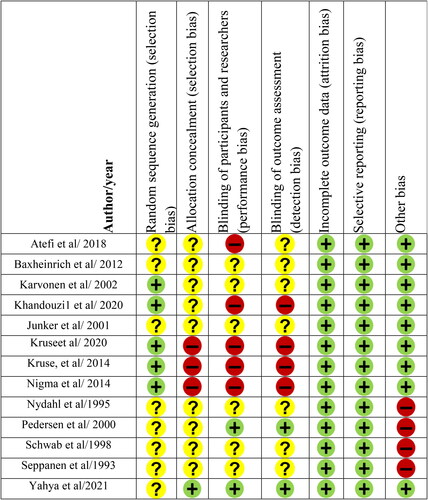
Figure 3. Forest plot of randomized controlled trials investigating the comparison of canola oil and olive oil consumption on the serum HDL-c.
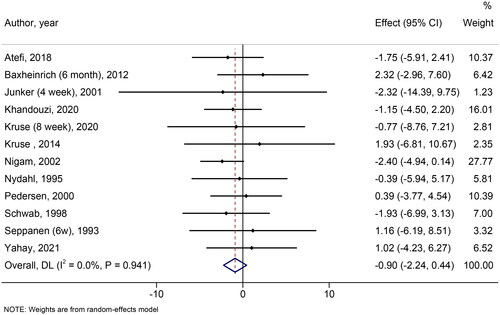
Figure 4. Forest plot of randomized controlled trials investigating the comparison of canola oil and olive oil consumption on the serum LDL-c.
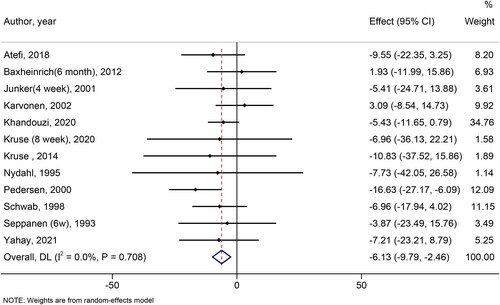
Figure 5. Forest plot of randomized controlled trials investigating the comparison of canola oil and olive oil consumption on the serum TC.
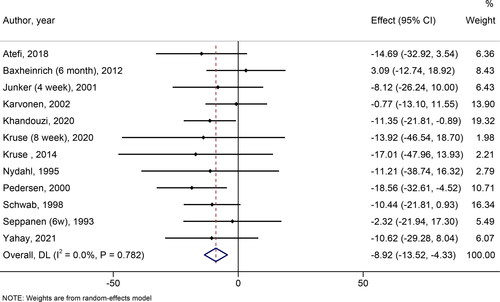
Figure 6. Forest plot of randomized controlled trials investigating the comparison of canola oil and olive oil consumption on the serum TG.
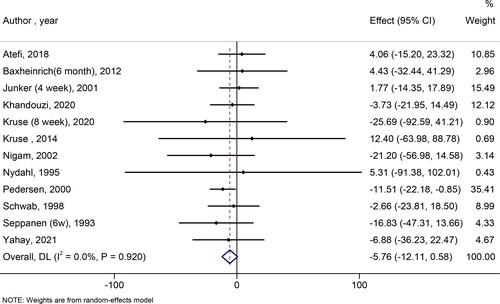
Figure 7. Forest plot of randomized controlled trials investigating the comparison of canola oil and olive oil consumption on the serum TC/HDL-c ratio.
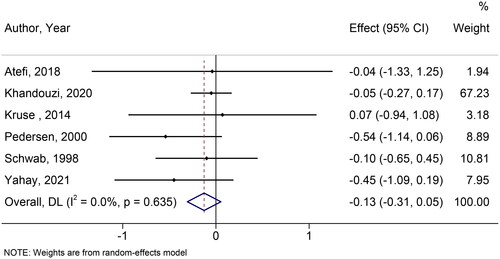
Figure 8. Forest plot of randomized controlled trials investigating the comparison of canola oil and olive oil consumption on the serum LDL-c/HDL-c ratio.
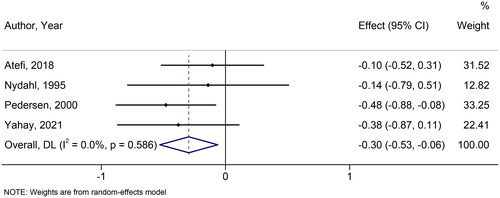
Figure 9. Forest plot of randomized controlled trials investigating the comparison of canola oil and olive oil consumption on the serum VLDL-c.