Figures & data
Figure 1. Discrete Pacific herring spawning locations in Puget Sound. Circled areas represent site-specific fidelity for distinct stocks (Stick et al. Citation2014). Dotted circles indicate the four central Sound stocks that were the focus of this study. Map courtesy of Blake Feist adapted from Shelton et al. Citation2017.
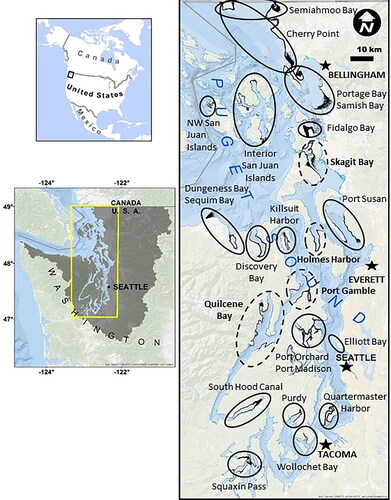
Figure 2. Estimated Puget Sound herring spawning biomass for the four stocks from Quilcene Bay, Port Gamble, Holmes Harbor, and Skagit Bay from 1976 to 2016. Estimates from spawn deposition surveys, acoustic/trawl surveys of schooling spawners, or both (Stick et al. Citation2014, Sandell et al. Citation2019).
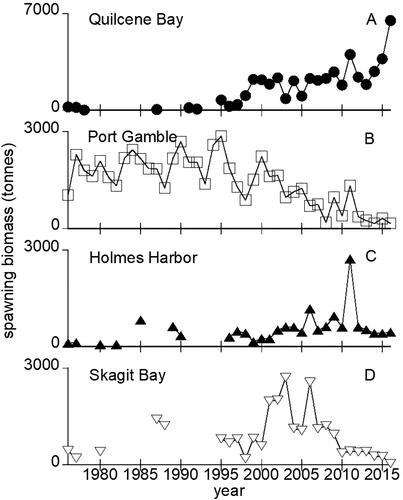
Table 1. Stock condition, connection, and 5 year mean spawning biomass reported in 2012 and 2016 for select Puget Sound herring stocks (Stick et al. Citation2014; Sandell et al. Citation2019).
Table 2. Transition values (and standard deviation, std) for each stock’s life history matrix. Additionally, the timespan and number of years (n) of acoustic data used to calculate the transition values are listed (Stick et al. Citation2014). Reproduction includes fecundity, survival between egg-stage and initial recruitment at age two. Age 1 survival is a placeholder to allow annual time steps. Age 2 survival includes survival and recruitment to reproductive maturity at age 3. All other survival values are survival to the next year class.
Table 3. Population model ceiling carrying capacity for age one individuals of each stock and initial abundances for all model runs. Initial abundance value was the sum of all ages according to the stable age distribution.
Table 4. Oil spill impact scenarios to assess changes in herring abundance resulting from a localized spill in the spawning area for each Puget Sound herring stock. All scenarios start exposure at model year 5 and extend for a defined duration. Example calculation for 90% mortality: YOY survival = S1*(1–0.9).
Table 5. Sensitivity and elasticity values calculated from the baseline matrix for each stock.
Figure 3. Modeled Puget Sound herring stock abundances for baseline (open circles and gray upward error bars) and nine-year exposure scenario (filled circles and black downward error bars). Shaded area in panel B indicates a post-spill downward abundance deflection exceeding one standard deviation from the unexposed baseline. The mean annual values (solid lines) and associated standard deviations are derived from 100-year model runs repeated 1000 times.
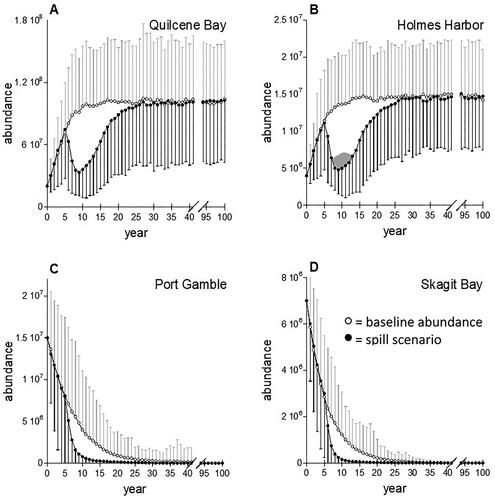
Table 6. Mean population growth rates (λ), standard deviations (std) calculated directly from each stock matrix. The percent change in growth rate resulting from toxicity to YOY herring (percent mortality on first year survival, S1). Values in italics exceed the percent of one standard deviation of λ.
Figure 4. Mean relative abundances in Puget Sound herring stocks following crude oil toxicity in spawning habitats that persist for 1, 2, 5, and 9 years. The modeled spill occurred at year 5. Standard deviations (not shown) averaged 63%, 55%, 267%, and 230% for Quilcene Bay, Holmes Harbor, Port Gamble and Skagit Bay, respectively.
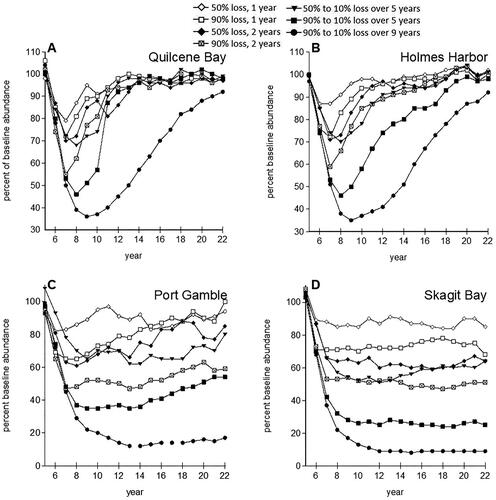
Table 7. Time to extinction for Skagit Bay and Port Gamble stocks for each exposure scenario.
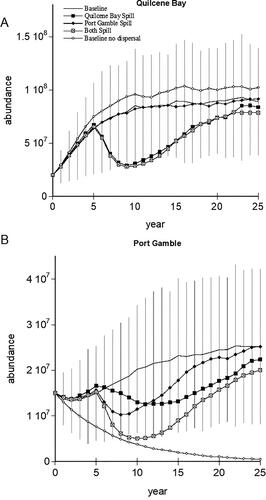
Figure 5. Mean Puget Sound herring abundance (solid line) and baseline standard deviation for Quilcene Bay (A) and Port Gamble (B) stocks examining the combinations of 5% dispersal between the stocks for baseline and longest exposure scenario affecting either or both stocks. Standard deviations for each scenario were similar, so only baseline are shown for clarity.