Figures & data
Table 1. Cultivars used in this study.
Table 2. Cultivars in which polymorphisms were detected in GmSEN1.
Figure 1. Complementation of Ljsen1–1 mutant by GmSEN1 genes. Nodules phenotypes (a), nodule number (b), weight of pink nodule (c), ARA per plant (d), and ARA per pink nodule weight (e) at 28 days after inoculation. Arrows indicate pink nodules. EV; plants introduced with empty vector as negative control. n.d.; not detected. EV, Peking type and Enrei type; n = 20, 26, 21, respectively. Error bars represent standard error (SE). *p < 0.05 and **p < 0.01 by Student’s t-test.
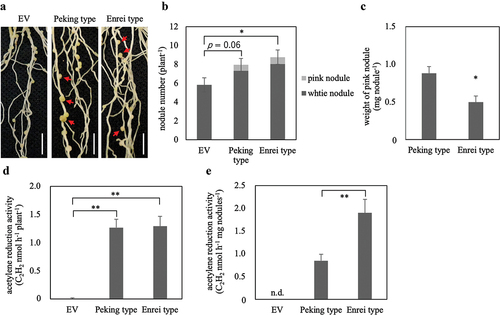
Figure 2. Effects of different genotypes of GmSEN1 on soybean growth and symbiotic parameters. These were measured at 28 days after inoculation with B. diazoefficiens. (a) Fukuyutaka, NILs of Peking type and Enrei type plants. Bars = 5 cm. (b–g) each graph is expressed as a relative value when the value of Fukuyutaka is 100. Relative shoot length (b), relative shoot weight (c), relative root weight (d), relative nodule number (e), relative nodule weight (f), relative ARA per plant (g), and relative ARA per nodule weight (h). Fukuyutaka, Peking type and Enrei type; n = 20, 18, 20, respectively. Error bars represent standard error (SE). Means denoted by the same letter are statistically non-significant at p < 0.05 (tukey-kramer multiple comparison test). (i) Relative GmSEN1b1 gene expression (normalized to that of GmActin as an internal control). Peking type and Enrei type; n = 7. Error bars represent standard error (SE). No statistical difference was observed (student t-test).
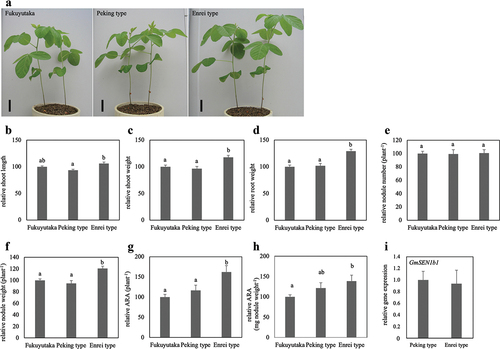
Table 3. Growth of BC5F4 generation progeny at 28 days after inoculation with B. diazoefficiens.
Figure 3. Multiple amino acid sequence alignment of VIT family and relative iron content of nodules. (a) multiple alignment were created using ClustalO (https://www.ebi.ac.uk/Tools/msa/clustalo/) with amino acid sequences of EgVIT1, AtVIT1, AtVTL1, OsVIT1, OsVIT2, TaVIT1, TaVIT2, MtVTL4, MtVTL8, LjSEN1, GmSEN1a1 (GmVTL1a), GmSEN1a2, GmSEN1b1 (GmVTL1b) and GmSEN1b2. ‘*’ indicates an amino acid conserved in all sequences; ‘:’ indicates conservation between groups of amino acids with strongly similar properties; ‘.’ indicates conservation between groups of amino acids with weakly similar properties. The secondary structure of VIT family indicates above the sequence. Red boxes indicate amino acid reported on Brear et al. (Citation2020) to be required for iron transport in yeast. Green boxes are important for ion translocation from the MBD to the TMD. Blue boxes are involved in ion binding in the MBD (Kato et al., Citation2019). Yellow box indicates the mutation position in Enrei type SEN1. (b) The relative iron content of nodule formed in roots of Peking type and Enrei type. Peking type and Enrei type; n = 30. Bars represent standard error (SE). **p < 0.01 by Student’s t-test.
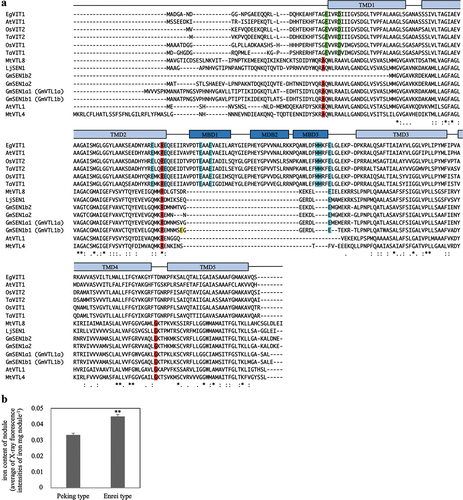
Figure 4. Relative growth of NILs at 28 days after inoculation with B. diazoefficiens with KNO3. Each graph is expressed as a relative value when the value of Peking type of 0% is 100. Relative shoot length (a), relative shoot weight (b), relative root weight (c), relative nodule number (d), relative nodule weight (e), relative ARA per plant (f), and relative ARA per nodule weight (g). 0% of Peking type and Enrei type; n = 10, 10, 50% of Peking type and Enrei type; n = 10, 10, 100% of Peking type and Enrei type; n = 9, 9, respectively. Error bars represent standard error (SE). *p < 0.05 and **p < 0.01 by Student’s t-test.
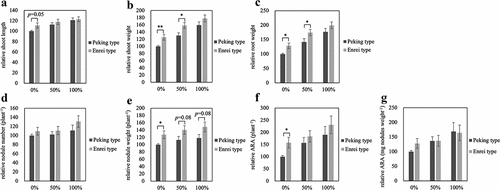
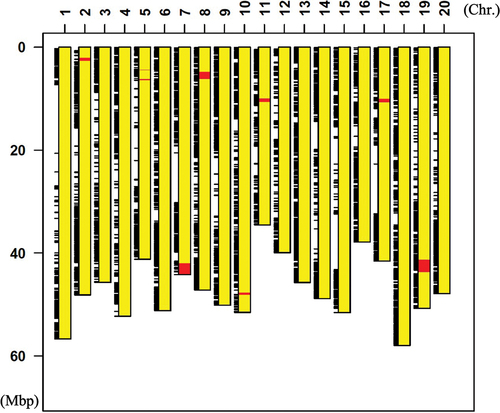
Figure 5. Diagrammatic representation of graphical genotype of Enrei type NIL plant (BC5F5). Yellow boxes indicate chromosome region derived from Fukuyutaka, and red boxes indicate chromosome region derived from Enrei. Black bars indicate SNPs detected between Enrei type NIL and Williams W82.