Figures & data
Figure 1. Overview of elements of various formal frameworks in art. The highlighted elements are the formal elements that are used in the framework shown in . As can be seen, in our own framework we added “material” to the list. The colours refer to the colours used in , where we analyse the usage of the Vision and Depiction Framework elements in practice.
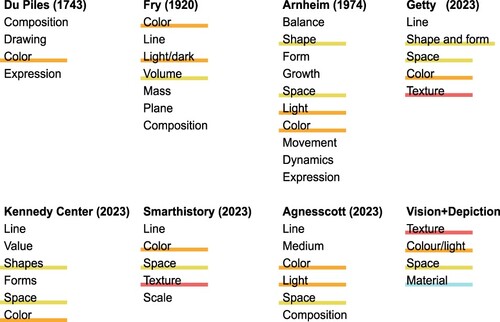
Figure 2. Framework to analyse the form and content of pictures. The y-axis refers to the traditional formal analysis elements from which we selected those that have been studied psychophysically. The x-axis implies that all formal elements can be studied both in the (physical) medium and the (perceived) motif. The z-axis relates the formal elements to the content and context, which are often discussed in the theory of semiotics and iconography.
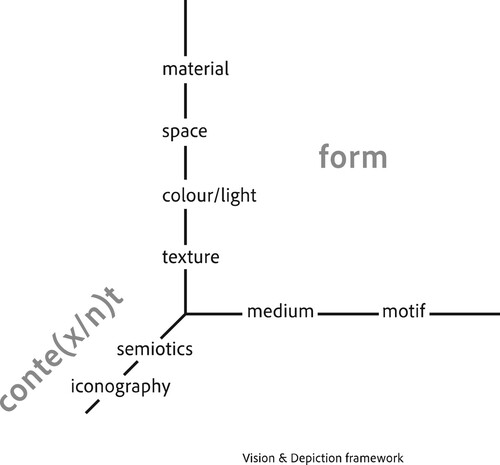
Figure 3. Statistics of chosen pictures. On the left, an ordered histogram showing a clear preference of some pictures over others. On the right, a cumulative histogram.
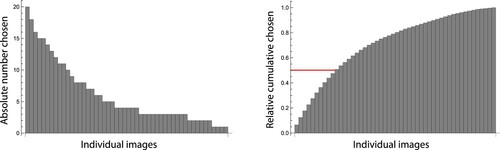
Figure 4. Histogram of V + D framework elements, the y-axis denotes absolute frequencies.
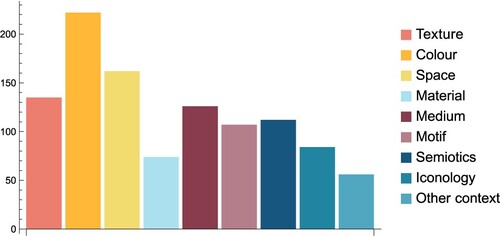
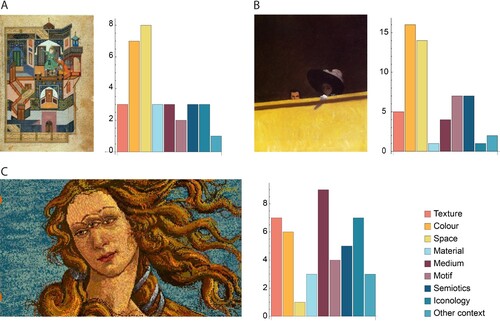
Figure 5. Three example works with histograms of chosen framework labels. The y-axis denotes absolute frequencies. (A) Kamāl ud-Dīn Behzād (1450–1535): Yusuf and Zulaikha. (B) Félix Vallotton (1865–1925): La Loge de Théatre, le Monsieur et la Dame, 1909, private collection. (C) Andy Warhol: Venus, 1985, The Andy Warhol Museum, Pittsburgh, www.warhol.org.