Figures & data
Figure 1. Land use structure of the original Palestinian town.
Figure 2. Left- regional map of Israel. Right- distribution of Palestinian towns in northern and Central Israel (agricultural towns, excluding Bedouin towns which have different spatial aspects).
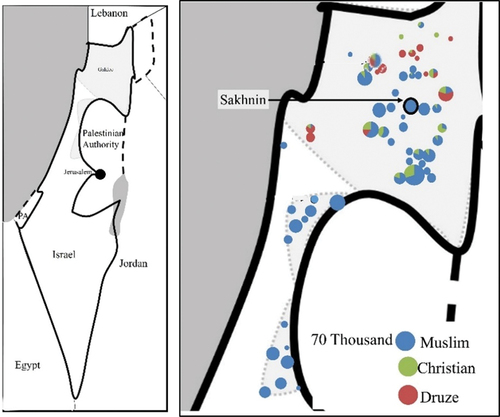
Figure 3. Type of land ownership in Sakhnin.
Figure 4. Clan and mixed neighbourhoods in Sakhnin.
Figure 5. Scheme of types of buildings’ spatial distribution (observed value/expected value) (a) clustered, patterns, (b) random,
, (c) dispersed,
.
Figure 6. Aerial map of back-to-back familial complexes.
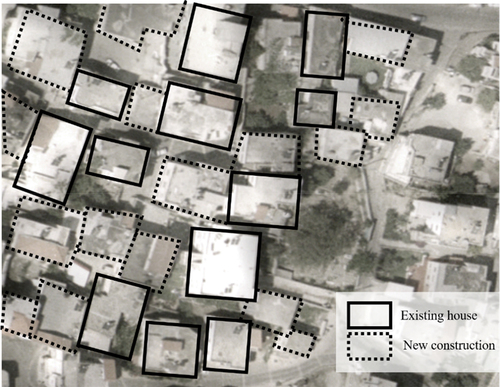
Figure 7. Generational construction of familial complex.
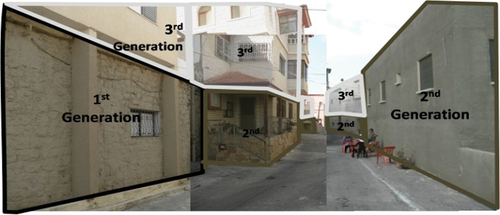
Table 1. Construction coverage in both types of neighbourhoods at the beginning and end of the study period.
Table 2. The average distance between buildings in each neighbourhood in Sakhnin, delineating the observed average distance, the expected average distance (considering random dispersal), and the actual pattern, based on the NNI (calculated as per the observed divided by the expected value).
Figure 8. Additional construction by years in clan and mixed neighbourhoods.
Figure 9. Dynamics of the index for clan and mixed neighbourhoods between 1988 and 2009.
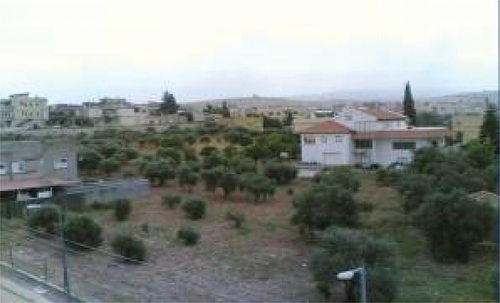
Figure 10. Preservation of a familial yard (olive trees in the agricultural plots) for future construction for the next generation.