
Figures & data
Figure 1. Stakeholder management, engagement and participation.
Source: Adapted from Weder (Citation2022), Weder and Erikson (Citation2023).
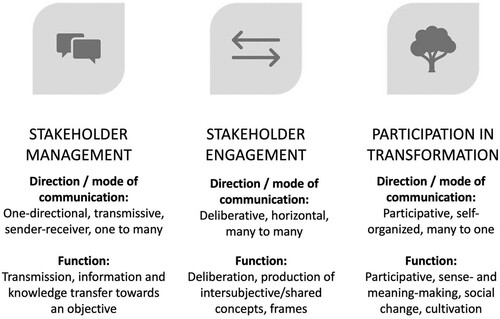
Figure 2. Inputs, processes and outcomes of the Australian citizens’ panels’ : A graphic abstraction where Gastil's (Citation2018) framework is used as a scaffold.
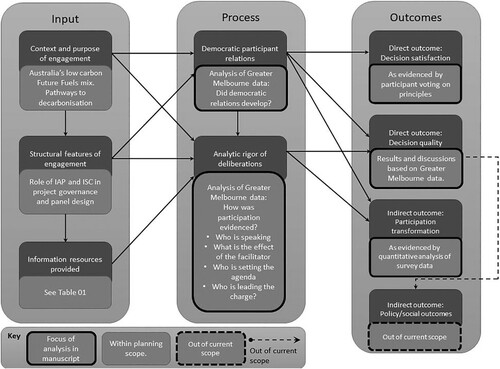
Table 1. Participant demographics for citizens’ panel.
Table 2. Weekly topics and key questions addressed within the citizens panels.
Table 3. Questions covered in each week with reflection on complexity.
Table 4. Data items and details for Greater Melbourne citizens’ panel.
Figure 3. The number of interactions (time spoken) each week divided into columns representing the interactions by the facilitator, male and female participants.
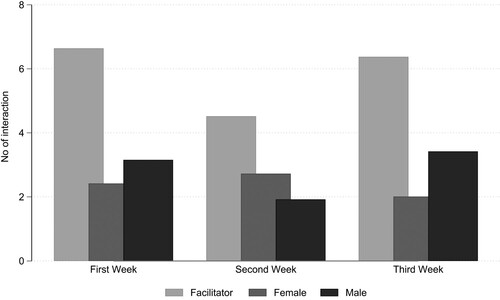
Figure 4. The word count for each interaction by week and by facilitator, male and female participants.
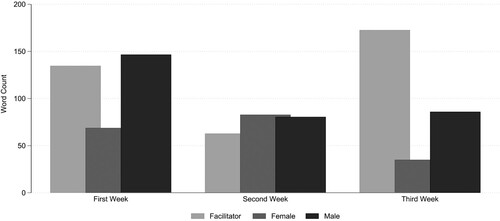
Figure 5. Number of interactions (times participants spoke) by male and female participants in each activity by week.
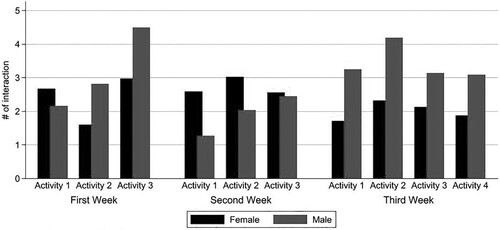
Figure 6. Word count of interactions by male and female participants in each activity in each week.
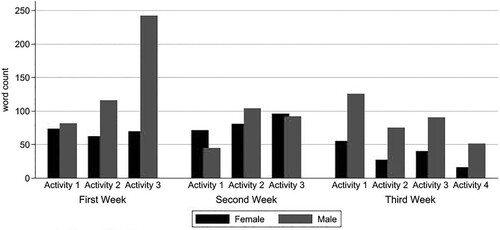
Figure 7. The number of participant interactions (times participants spoke) over the entire citizens’ panels process divided into columns representing the gender of the facilitator.
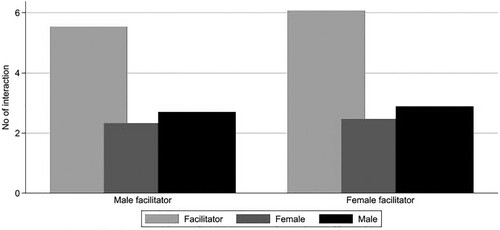
Figure 8. Number of themes started by male or female participants included in the summary report.
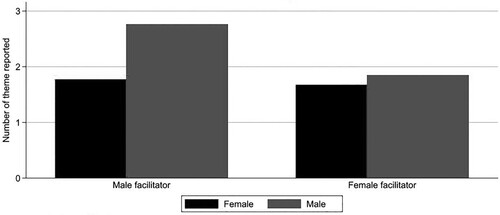
Figure 9. Sankey diagram to show the flow of exchanges during deliberation sessions.
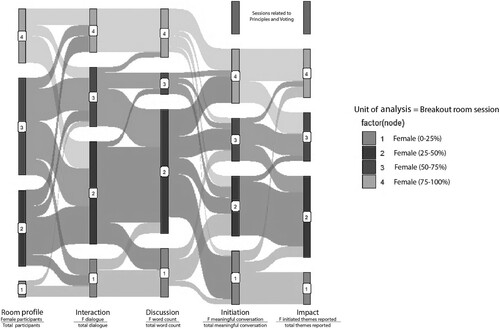
Figure 10. How participants rate their overall experience by gender.
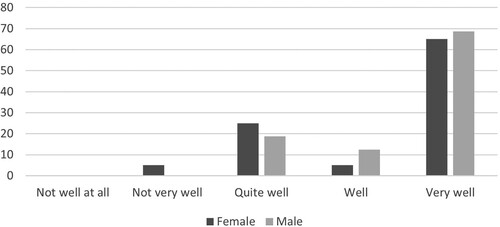
Figure 11. How participants changed or broadened their view after the week by gender.
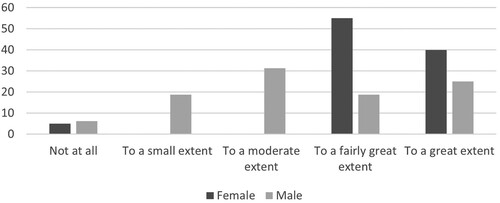
Table 5. Remaining principles developed by the Greater Melbourne panel.