
Figures & data
Figure 1. (a) Diagram of the experimental setup, (b) the diagram of the experimental setup with the combination of red, blue, and amber lights and (c) the closed thin film nutrient loop system hydroponic system.
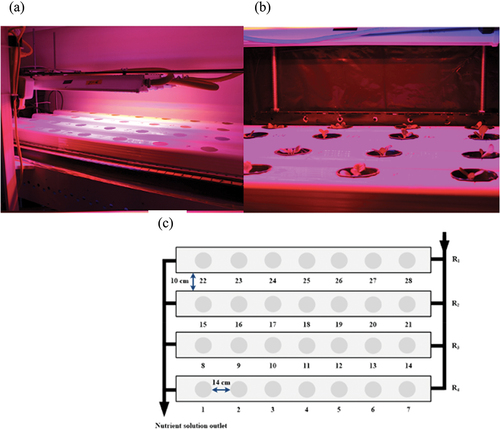
Figure 2. Relative spectral distributions exhibited by the experimental red (635 nm), blue (445 nm), and amber (595 nm) LEDs.
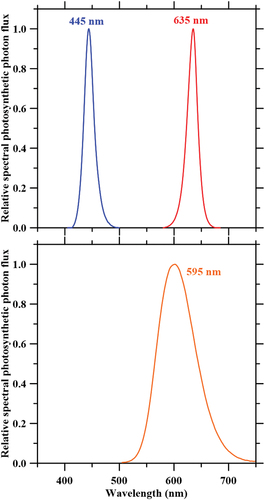
Table 1. Photosynthetic photon flux density (PPFD) and full width at half maximum (FWHM) measurements recorded for each LED light treatment.
Figure 3. PCA eigenvectors for lettuce plants grown under red light (635 nm), blue light (445 nm), amber light (595 nm), combined red-blue-amber light (RBA) light treatments with full range of photosynthetic photon flux densities (PPFD; 39 to 1321 µmol·m−2·sec−1). Red light, blue light, amber light, combined red-blue-amber light, and PPFD were considered in relation to fresh mass (FM) and dry mass (DM). Numbers (1–28) on the graph represent the data points (light treatments) used in the study.
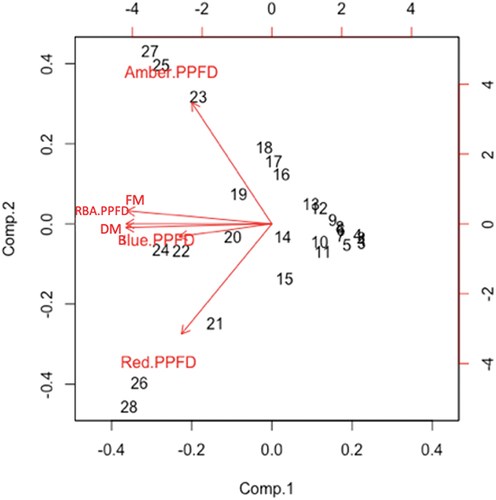
Figure 4. PCA eigenvectors for lettuce plants grown under red light (635 nm), blue light (445 nm), amber light (595 nm), combined red-blue-amber light (RBA) light treatments with (a) a lower light intensity range (39 to 441 µmol·m−2·sec−1) and (b) a higher light intensity range (511 to 1321 µmol·m−2·sec−1) of photosynthetic photon flux densities (PPFDs). Red light, blue light, amber light, combined RBA light, and PPFD were considered in relation to fresh mass (FM) and dry mass (DM). Numbers (1–28) on the graph represent the data points (light treatments) used in the study.
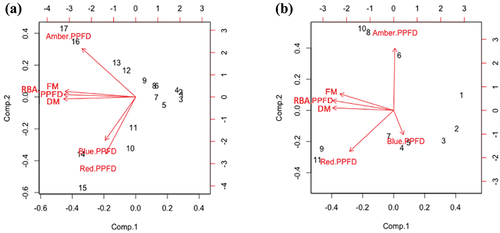
Figure 5. Effects of photosynthetic photon flux density (PPFD) on lettuce plant fresh mass (FM) yield when grown under red (635 nm), blue (445 nm), amber (595 nm), and combined red-blue-amber (RBA) LEDs. The daily light integral (DLI) was calculated based on the 16-h photoperiod used in this study.
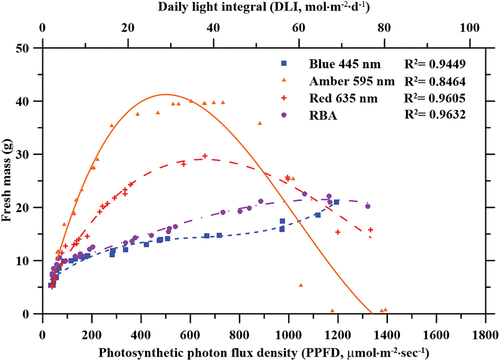
Figure 6. Effects of photosynthetic photon flux density (PPFD) on lettuce plant dry mass (DM) yield when grown under blue (445 nm), amber (595 nm), red (635 nm), and combined red-blue-amber (RBA) LEDs. The daily light integral (DLI) was calculated based on the 16-h photoperiod used in this study.
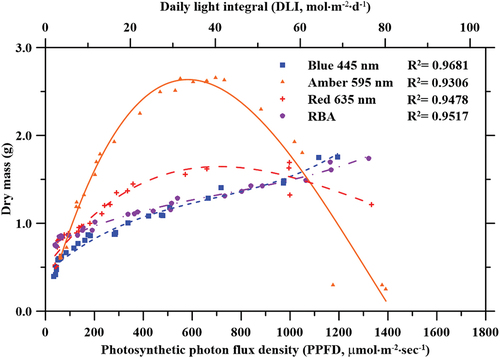
Figure 7. Effects of photosynthetic photon flux density (PPFD) on lettuce plant leaf shape index (LSI) when grown under blue (445 nm), amber (595 nm), red (635 nm), and combined red-blue-amber (RBA) LEDs.
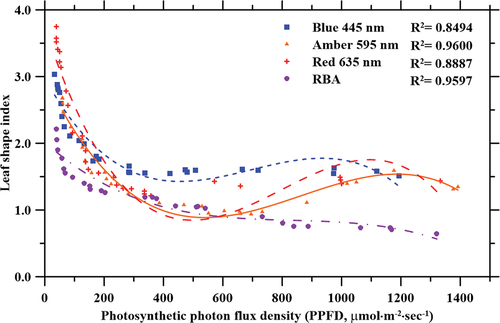
Figure 8. Effects of photosynthetic photon flux density (PPFD) on total leaf area (TLA) of lettuce plants grown under blue (445 nm), amber (595 nm), red (635 nm), and red-blue-amber (RBA) light treatment. In (a), curves show the relationship between PPFD and TLA. In (b), curves show the relationship between TLA and fresh mass FM.
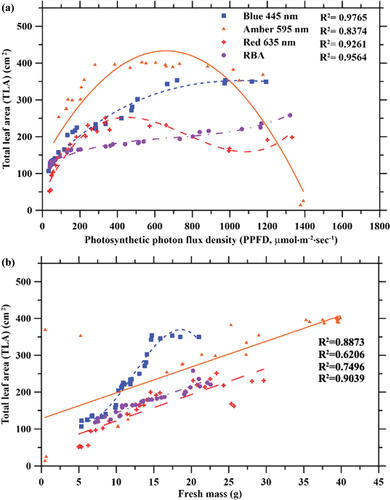
Figure 9. Effect of photosynthetic photon flux density (PPFD) on lettuce leaf SPAD measurements (chlorophyll) after an 18-day growth period under blue (445 nm), amber (595 nm), red (635 nm), and RBA light treatments.
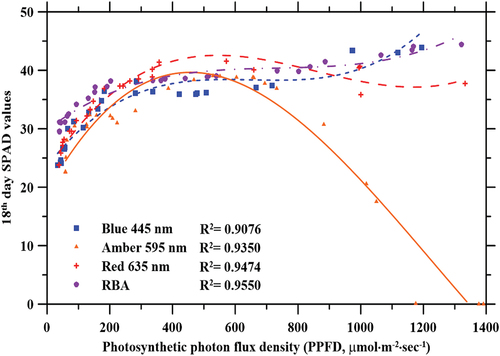
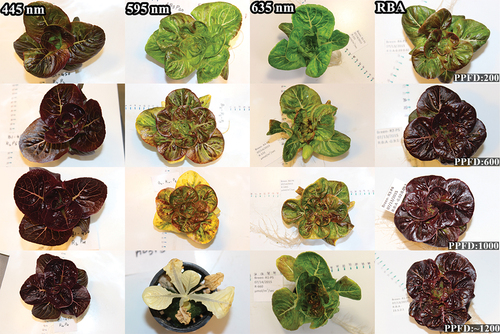
Figure 10. Representative images of lettuce plants grown under red (635 nm), blue (445 nm), amber (595 nm), and RBA light treatments with different PPFDs. Values in the lower right corner of each photograph represent the photosynthetic photon flux density (PPFD) in µmol·m−2·sec−1.
Data availability statement
The data that support the findings of this study are available on request from the corresponding author, [M. L.].