Figures & data
Table 1. Characteristics of the participants.
Figure 1. Study design. Participants completed eight (control group) to nine (training group) visits. The eligibility assessment and tests of word recognition in quiet (WRS) and auditory working memory (digit span) were performed during the first visit. Outcome measures of phoneme identification and sentence intelligibility were obtained upon the first (pre-intervention), the eighth (post-intervention) and the ninth (follow-up) visit. During two weeks between the first and the eighth visit, the participants received the allocated intervention.
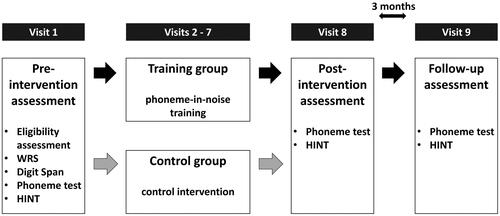
Figure 2. Training procedure. After the stimulus was presented, the participants were asked to select a response from five alternatives displayed on a screen. The response was followed by feedback, which was both visual and auditory. The participants were provided with a Repeat button (available both before and after the response) to replay the audio examples as many times as they wanted.
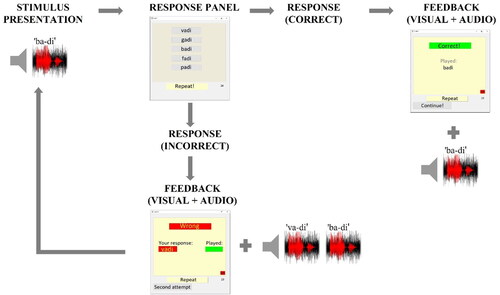
Table 2. Group means, standard deviations (SD) and results of a between-group t-test (t-statistics and p-values) for age, PTA, auditory digit span (DS) score, baseline phoneme identification scores (C1, V and C2) and SRTs in HINT.
Figure 3. Pre-intervention (empty bars) and post-intervention (filled bars) phoneme identification scores in % correct. The targets C1, V and C2 are represented in the upper, middle and bottom row, respectively. Results for the training group are shown in the left column and results for the control group are represented in the right column. Numbers 1–20 correspond to the individual participants. M indicates mean scores for each group. Error bars represent one standard error of the mean.
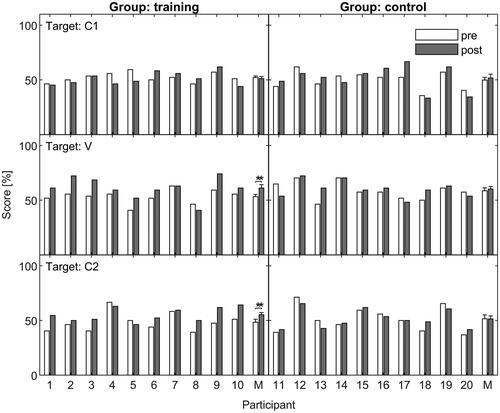
Figure 4. Pre-intervention (empty boxes) and post-intervention (filled boxes) SRTs for the training group (left) and the control group (right). The medians are indicated by the horizontal lines. The 25th and 75th percentiles are represented by the bottom and the top edge of the box respectively. The whiskers indicate the most extreme observations not considered outliers. Individual data points are represented by the black dots. Results for the pre-intervention and the post-intervention condition obtained from the same listener are indicated by the connecting dashed lines.
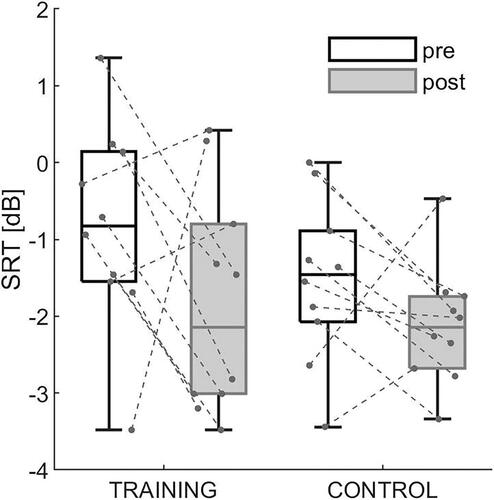
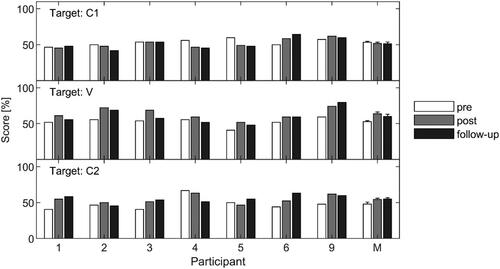
Figure 5. Phoneme identification scores obtained at pre-training (white), post-training (grey) and follow-up (black) visit. Results are shown for target C1 (upper panel), V (middle panel) and C2 (bottom panel). Numbers 1–6 and 9 represent the individual participants. The mean scores are shown on the right. Error bars represent one standard error of the mean.