
Figures & data
Figure 1. Temporal evolution of material properties of shotcrete with the uniaxial 28-day compressive strength = 20 MPa, and the different cement types given in : (a) uniaxial compressive strength, (b) Young’s modulus, (c) creep modulus.
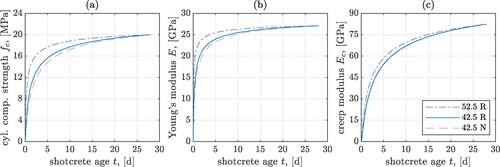
Table 1. Values of sE and for three typical cement types [Citation42]; and of uniaxial compressive strength reached 28 days after production,
for three typical shotcrete strength classes.
Figure 2. Illustration of slender arch-like tunnel cross section with radius R and thickness h, global Cartesian base frame and local polar base frames
the latter is indicated at the left and right impost of the arch-like tunnel cross section, labeled by polar angles
and
reproduced from [Citation14], copyright by the authors.
![Figure 2. Illustration of slender arch-like tunnel cross section with radius R and thickness h, global Cartesian base frame ex,ey,ez, and local polar base frames er(φ),eφ(φ),ez; the latter is indicated at the left and right impost of the arch-like tunnel cross section, labeled by polar angles φRI and φLI, reproduced from [Citation14], copyright by the authors.](/cms/asset/73377609-3e5f-4d34-8b68-123a1c36ac85/umcm_a_2332474_f0002_b.jpg)
Figure 3. Cross section of the Sieberg tunnel with focus on the top heading: definition of -
and
-
coordinate frames, geometric properties and locations of measurement points MP1, MP2, and MP3, reproduced from [Citation14], copyright by the authors.
![Figure 3. Cross section of the Sieberg tunnel with focus on the top heading: definition of ex-ey and er(φ¯)-eφ(φ¯) coordinate frames, geometric properties and locations of measurement points MP1, MP2, and MP3, reproduced from [Citation14], copyright by the authors.](/cms/asset/187404c5-8687-429d-b70b-99f9736d7245/umcm_a_2332474_f0003_b.jpg)
Figure 4. Geological longitudinal section of the Sieberg tunnel: Representation of the geological conditions in the area of the measurement cross-section MC1452 installed on December 14, 1997.
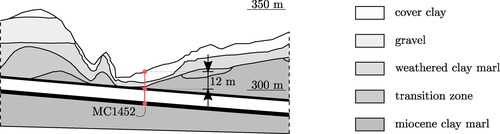
Figure 5. Distribution of radial and circumferential displacements at shell midsurfaces (a-f), and of generator rotations (g-i) along the circumference of the top heading (index 1) of the Sieberg tunnel at measurement cross section MC1452, and the temporal evolution of maximum and minimum values (index 2) for the time points according to Table A2; determined by hybrid analyses based on aging elasticity (a,d,g), on aging viscoelasticity (b,e,h), on aging nonlinear viscoelasticity (c,f,i), respectively.
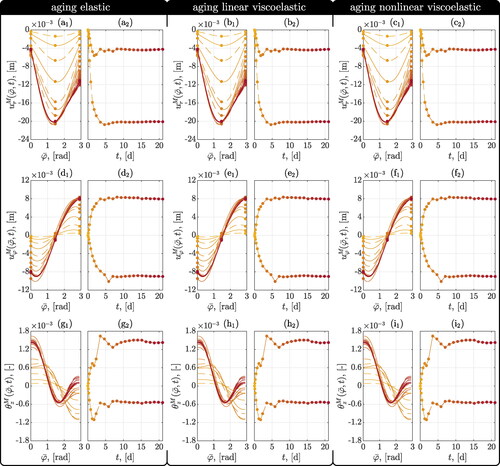
Figure 6. Midsurface displacement distribution with corresponding shell generator lines of length at
(a), and at
of the Sieberg tunnel at the measurement cross-section MC1452 (magnification factor of the displacements: 35); determined by hybrid analysis based on aging nonlinear viscoelasticity.
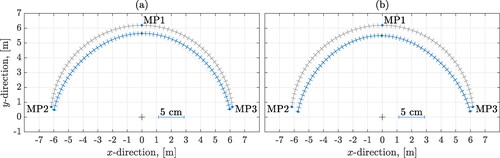
Figure 7. Distribution of circumferential normal forces (a-c), bending moments (d-f), and of ground pressure (g-i) along the circumference of the top heading (index 1) of the Sieberg tunnel at measurement cross section MC1452, and the temporal evolution of maximum and minimum values (index 2) for the time points according to Table A2; determined by hybrid analyses based on aging elasticity (a,d,g), on aging viscoelasticity (b,e,h), on aging nonlinear viscoelasticity (c,f,i), respectively.
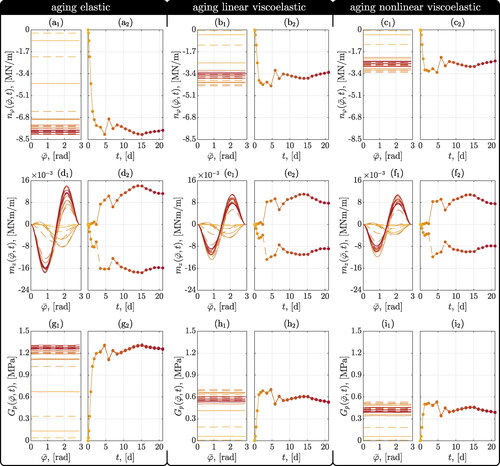
Figure 8. Distribution of degree of utilization for (a-c), for r = R (d-f), and for
(g-i), along the circumference of the top heading (index 1) of the Sieberg tunnel at measurement cross section MC1452, and the temporal evolution of maximum and minimum values (index 2) for the time points according to Table A2; determined by hybrid analyses based on aging elasticity (a,d,g), on aging viscoelasticity (b,e,h), on aging nonlinear viscoelasticity (c,f,i), respectively.
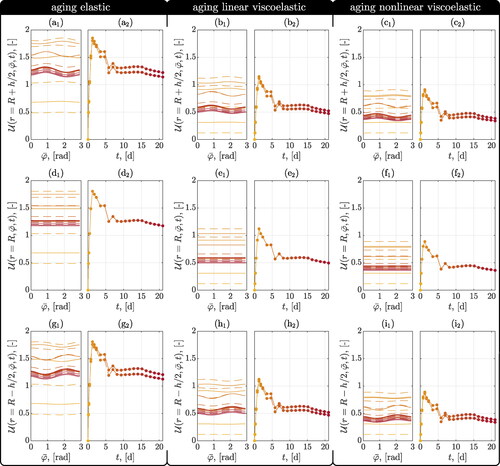
Table A1. Cartesian displacement components (in meters) measured at three geodetic reflectors installed within cross section MC1452 of Sieberg tunnel; as seen in .
Table A2. Radial and circumferential displacement components (in meters) measured at three geodetic reflectors installed within cross section MC1452 of Sieberg tunnel; as seen in .