
Figures & data
Figure 1. Study flow charts. (A) Workflow for the genome-wide SNP-by-sex interaction and sex-stratified analysis. (B) Flow chart for sample and marker quality control.
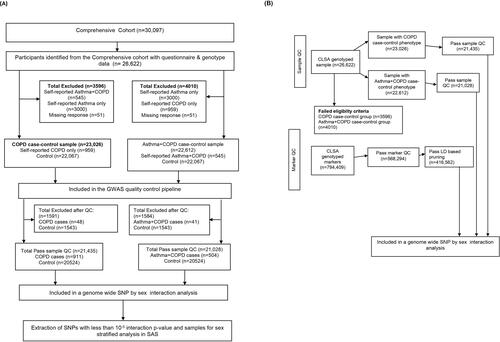
Table 1. Descriptive characteristics of the study population.
Figure 2. Quantile-Quantile plots (Q-Q plot) showing the distribution of observed versus Expected pvalue. (A) Q-Q plot for the genome-wide SNP-by-sex interaction for asthma-COPD phenotype. Genomic inflation factor, lambda (λ) = 1.00. (B) Q-Q plot for the genome-wide SNP-by-sex interaction for COPD. Genomic inflation factor, lambda (λ) = 1.00.
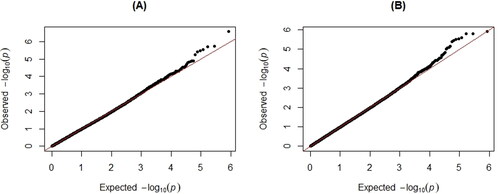
Table 2. 18 Signals of the SNP-by-Sex Interactions with pvalue less than 10¯5 for asthma-COPD phenotype.
Table 3. 28 Signals of the SNP-by-Sex Interactions with pvalue less than 10−5 for COPD.
Table 4. Result of sex-stratified analysis for asthma-COPD phenotype.
Figure 3. Forest plot showing the direction of effects of the male-specific SNPs associated with asthma-COPD phenotype from the sex-stratified analysis.
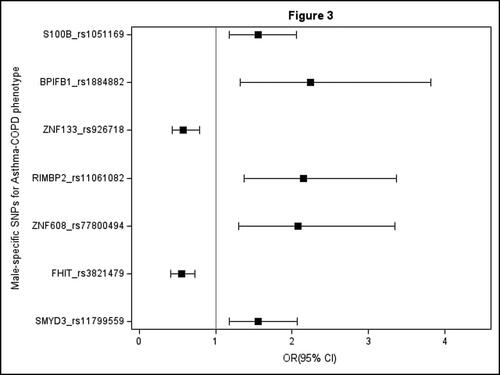
Table 5. Result of sex-stratified analysis for COPD.
Figure 4. Forest plots showing the direction of effects for the sex-specific SNPs associated with COPD from the sex-stratified analysis. (A) Males. (B) Females. Only significant SNPs after the Bonferroni adjustment were plotted.
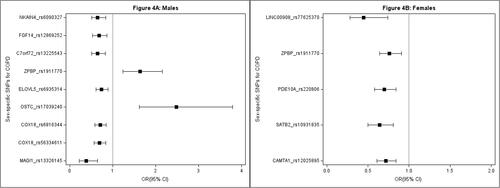
Figure 5. Regional plots for the 7 male-specific SNPs associated with asthma-COPD phenotype showing their respective genomic locations. (A) rs11799559 in SMYD3 gene. (B) rs3821479 in FHIT gene. (C) rs77800494 near ZNF608 gene. (D) rs11061082 near RIMBP2 gene. (E) rs926718 in ZNF133 gene. (F) rs1884882 near BPIFB1 gene. (G) rs1051169 in S100B gene.
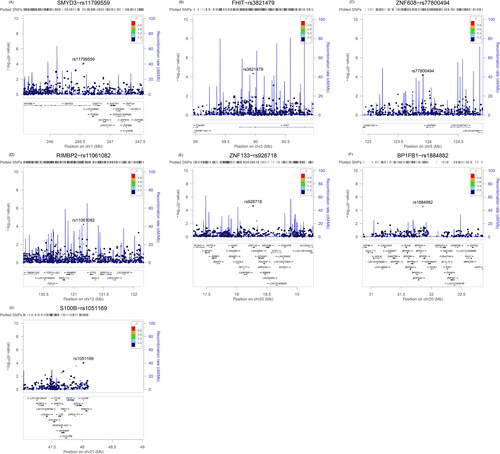
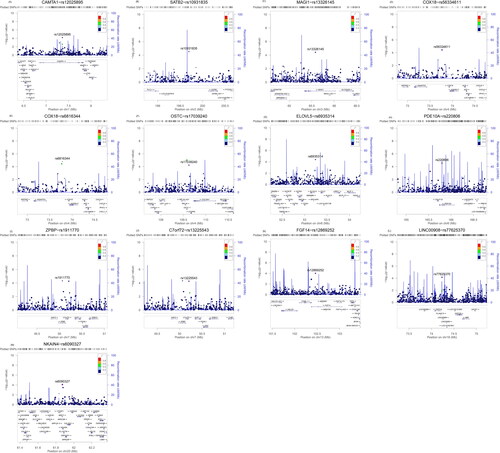
Figure 6. Regional plots for the sex-specific SNPs associated with COPD showing their respective genomic locations (A) rs12025895 in CAMTA1 gene. (B) rs10931835 near SATB2 gene. (C) rs13326145 in MAGI1 gene. (D) rs56334611 near COX18 gene. (E) rs6816344 near COX18 gene. (F) rs17039240 near OSTC gene. (G) rs6935314 near ELOVL5 gene. (H) rs220806 in PDE10A gene. (I) rs1911770 in ZPBP gene. (J) rs13225543 near C7orf72 gene. (K) rs12869252 in FGF14 gene. (L) rs77625370 near LINC00908 gene. (M) rs6090327 in NKAIN4 gene.
Supplemental Material
Download PDF (506.2 KB)Data availability statement
The datasets used in this study are not readily available. Data are only available from the Canadian Longitudinal Study on Aging (www.clsa-elcv.ca) for researchers who meet the criteria for access to de-identified CLSA data.