Figures & data
Figure 1. Chemical structure of the synthesized fluorophore.
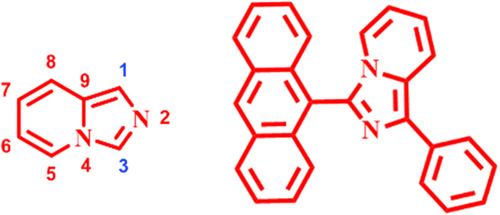
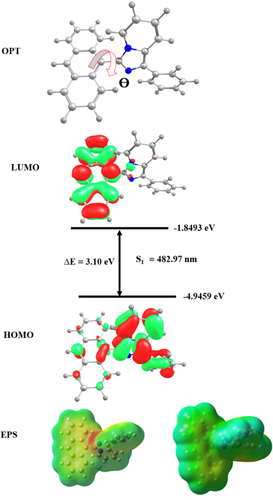
Figure 2. Optimized molecular geometry, HOMO/LUMO energy levels, and electrostatic potential map of ImPy-Ac.
Scheme 1. Synthetic route of ImPy-Ac.
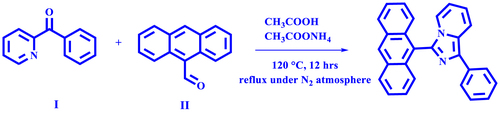
Figure 3. TGA curve and DSC curve under the N2 atmosphere of the fluorophore.
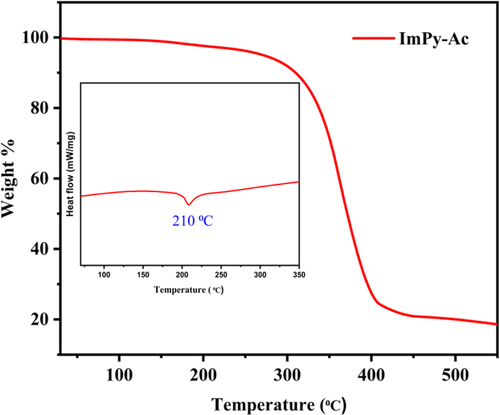
Figure 4. ORTEP diagram of the ImPy-Ac.
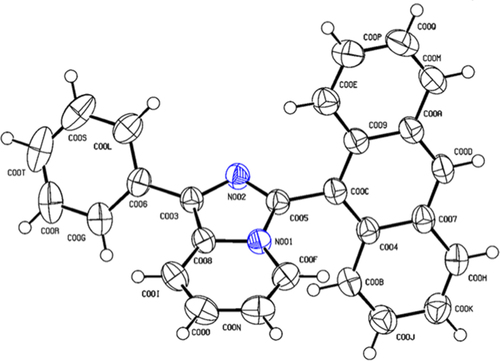
Figure 5. Single molecular geometry (a) and molecular packings with the views from X-axis (b), Y-axis (c), and Z-axis (d) of ImPy-Ac crystal.
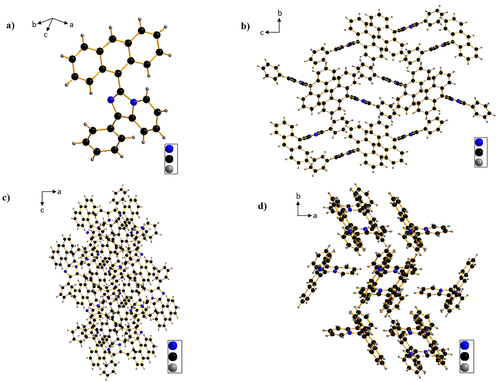
Figure 6. UV-vis spectra in dilute THF solution (10−5 M) (b) Diffuse reflectance spectra (DRS) measured using a solid compound.
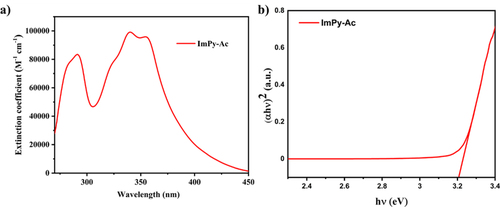
Figure 7. PL spectra of (a) ImPy-Ac solution in THF (10−5 M), (b) solid ImPy-Ac (c) Thinfilm.
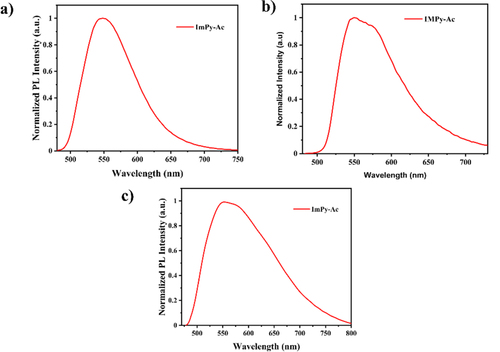
Table 1. Photophysical properties of ImPy-Ac.
Table 2. Electrochemical properties of ImPy-Ac.
Figure 8. Absorption and emission spectra of ImPy-Ac in different solvents and CIE coordinates.
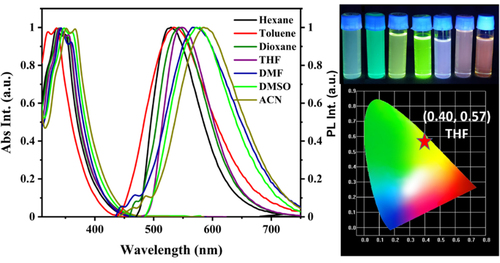
Figure 9. Cyclic voltammograms of ImPy-Ac.
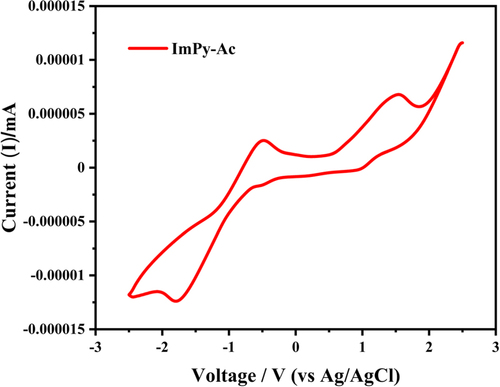
Table 3. Electroluminescent performance of ImPy-Ac.
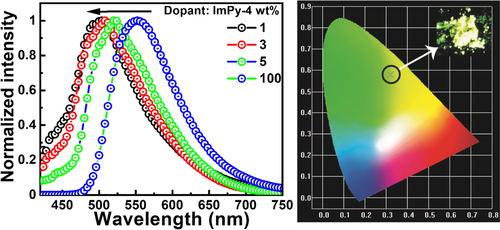
Figure 10. EL spectra and CIE Coordinate of fabricated white LED.
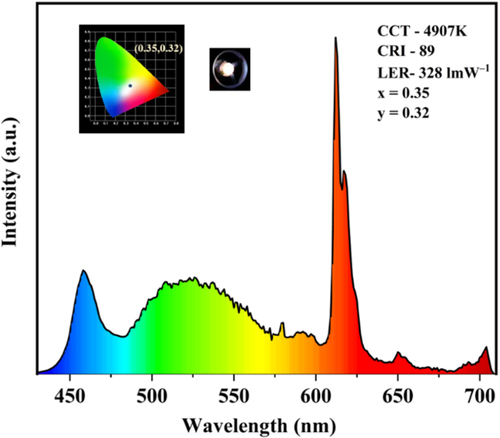
Figure 11. Schematic diagram of ImPy-Ac-based yellow OLED with energy level diagram and chemical structure of materials used.
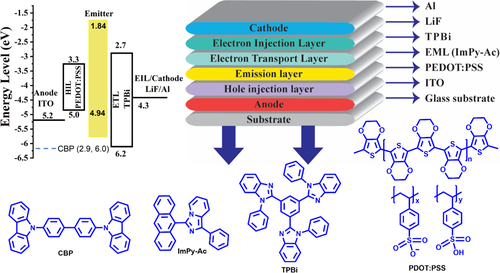
Figure 12. (a) current density vs voltage (b) luminescence vs voltage (V) (c) current efficiency (cd A–1) vs luminescence (cd m–2) (d) Power efficiency (lm W–1) vs luminescence (cd m–2).
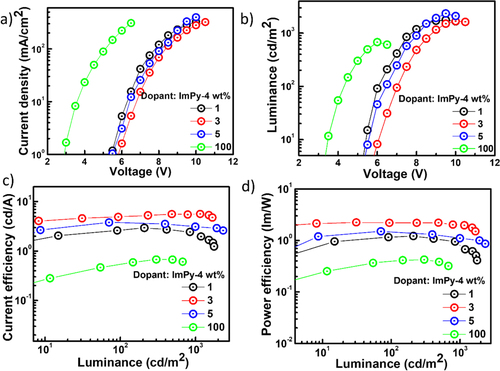
Figure 13. Electroluminescence spectra of ImPy-Ac.