Figures & data
Figure 1. Schematic diagram of the dengue model.
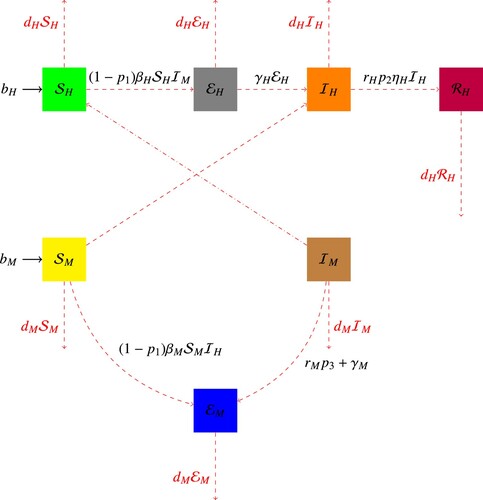
Table 1. Initial and parameters numerical values for dengue model.
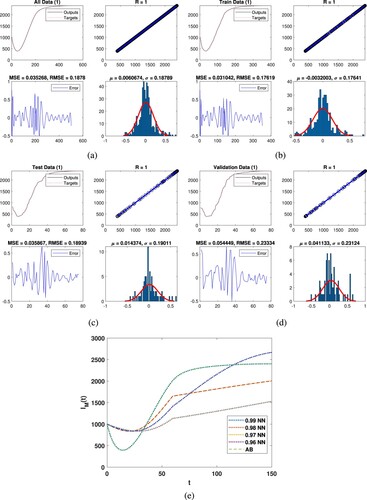
Figure 2. Graphically representation of class with deep neural network. (a) All data, (b) train data, (c) test data, (d) validation and (e) comparison of AB with NN.
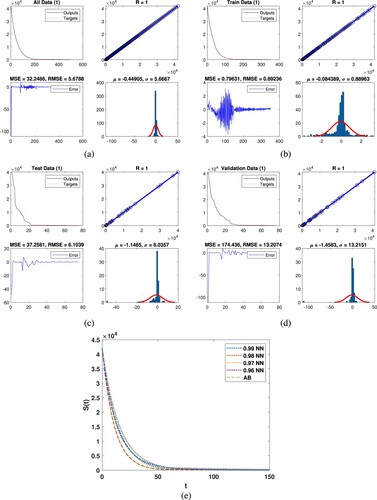
Figure 3. Graphically representation of class with deep neural network. (a) All data, (b) train data, (c) test data, (d) validation and (e) comparison of AB with NN.
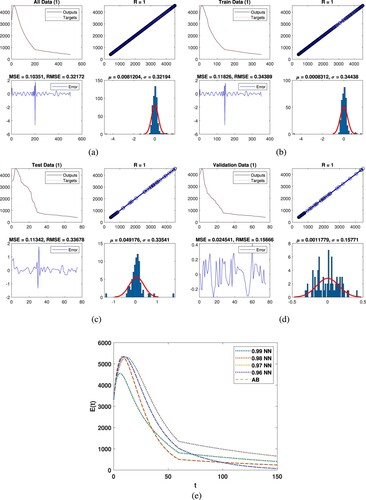
Figure 4. Graphically representation of class with deep neural network. (a) All data, (b) train data, (c) test data, (d) validation and (e) comparison of AB with NN.
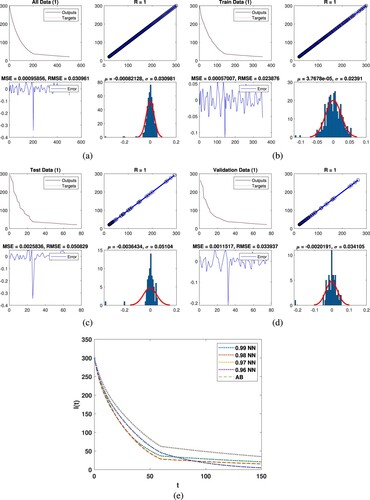
Figure 5. Graphically representation of class with deep neural network. (a) All data, (b) train data, (c) test data, (d) validation and (e) comparison of AB with NN.
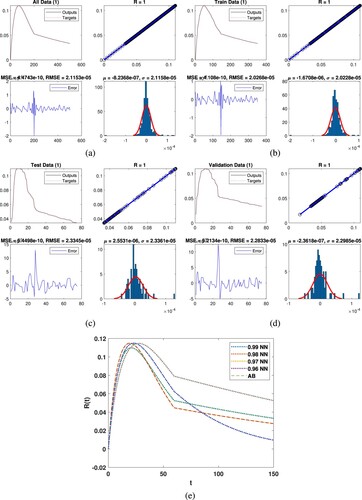
Figure 6. Graphically representation of class with deep neural network. (a) All data, (b) train data, (c) test data, (d) validation and (e) comparison of AB with NN.
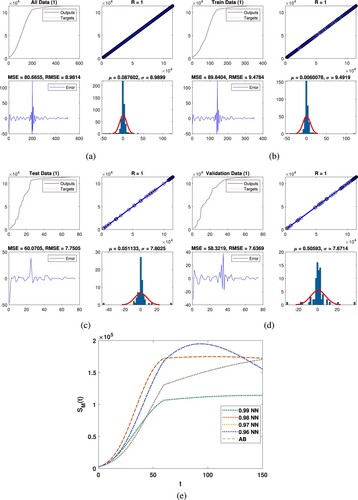
Figure 7. Graphically representation of class with deep neural network. (a) All data, (b) train data, (c) test data, (d) validation and (e) comparison of AB with NN.
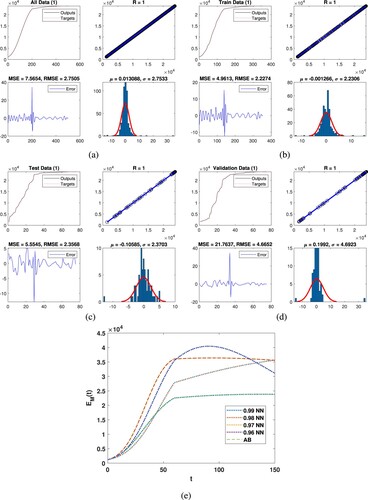
Figure 8. Graphically representation of class with deep neural network. (a) All data, (b) train data, (c) test data, (d) validation and (e) comparison of AB with NN.