115
Views
0
CrossRef citations to date
0
Altmetric
Research Article

Impact of uncertainty ascribed to defective products on supply chains

ORCID Icon &
Received 13 Mar 2023, Accepted 02 Apr 2024, Published online: 10 Apr 2024

Figures & data

Figure 1. The relationship of EquationEquations (8) and (Equationeq 10) when p=0.010.

Figure 1. The relationship of EquationEquations (8(8) u≥w+Π0R(q0∗)−ΠpR(q)pq.(8) ) and (Equationeq 10(10) u≤w−cp1−q0∗q.(10) ) when p=0.010.

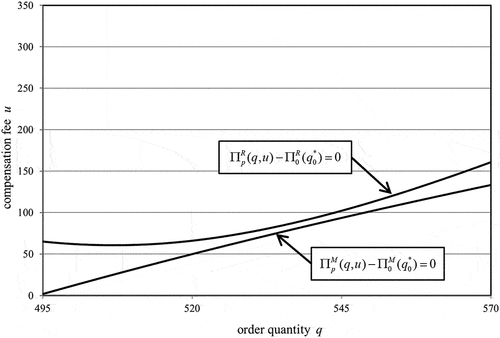
Figure 2. The relationship of EquationEquations (8) and (10) when p=0.025.

Figure 2. The relationship of EquationEquations (8(8) u≥w+Π0R(q0∗)−ΠpR(q)pq.(8) ) and (10) when p=0.025.

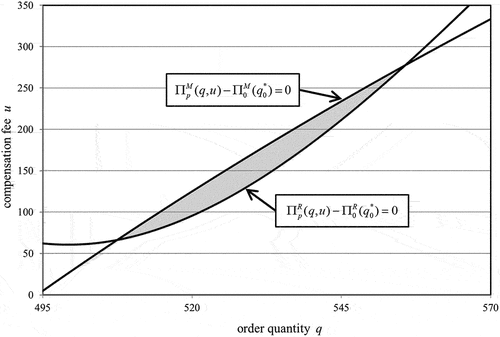
Figure 3. The incentive compatible condition when p=0.010 and discrete symmetrical triangle distribution with the range (300, 700).
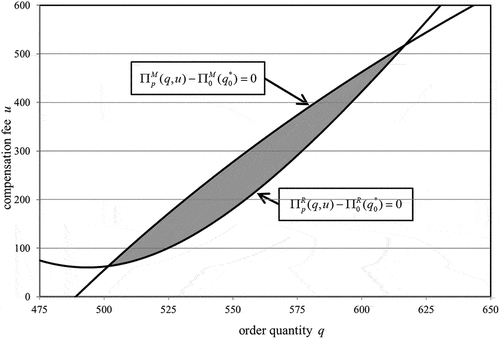
Figure 3. The incentive compatible condition when p=0.010 and discrete symmetrical triangle distribution with the range (300, 700).

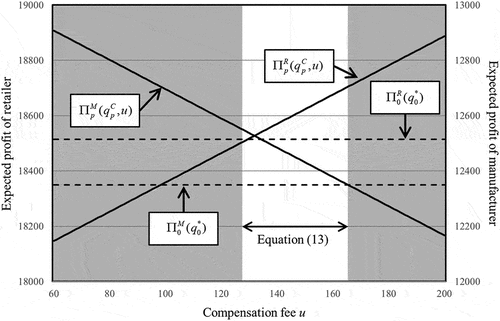
Figure 4. The expected profits and compensation fee when qpC=530.

Figure 4. The expected profits and compensation fee when qpC=530.

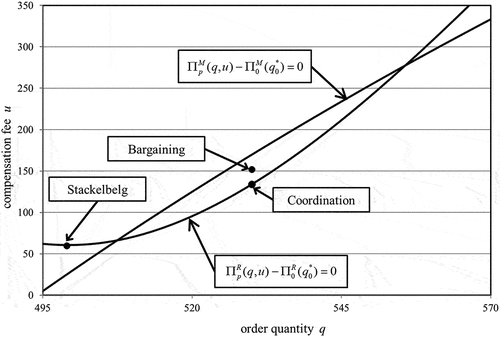
Figure 5. The solutions based on coordination, bargaining, and Stackelberg approaches when p=0.010.

Figure 5. The solutions based on coordination, bargaining, and Stackelberg approaches when p=0.010.

Table 1. The respective characteristics in case of p=0.010.