

Figures & data
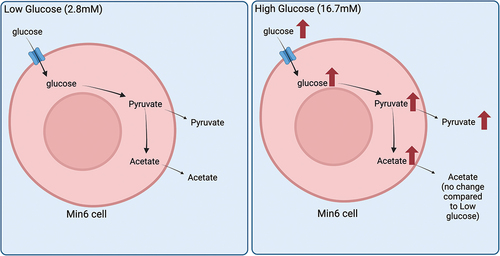
Figure 1. Total (intracellular + extracellular) levels of studied metabolites in response to incubation of Min6 cells under low glucose (LG, 2.8 mM) and high glucose (HG, 16.8 mM). (a) Illustration of the mechanism for labeled pyruvate and acetate produced from U-13C6 labeled glucose. GSIS studies (b), and intracellular ATP (c) and intracellular citrate (d) levels of LG and HG incubated Min6 cells. Total levels of (e) pyruvate, (f) pyruvate isotopologues, (g) acetate and (h) acetate isotopologues represented as fold change relative to U-13C6 LG condition. (i) Percentage of total acetate to total pyruvate in U-13C6 LG and HG condition. Experiments were conducted three independent times in triplicate each time. Data was analyzed by student’s t test (1B, 1C, 1D, 1E, 1 G and 1I) or by Two-way ANOVA (1F and 1 H). *p < .05, **p < .01, ***p < .001 and ****p < .0001. Black bar = LG, white bar = HG. Pyruvate Dehydrogenase (PDH), Pyruvate Carboxylase (PC), acetic acid (AA), and pyruvic acid (PA).
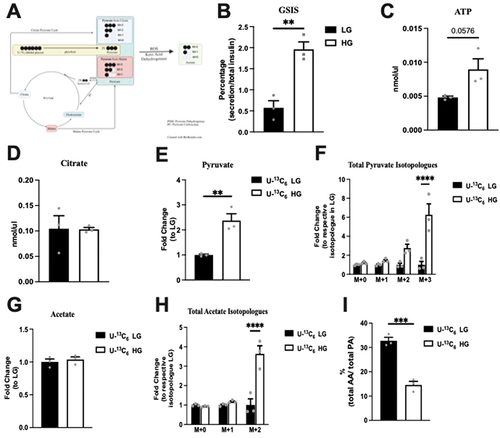
Figure 2. Intracellular pyruvate, acetate, and their isotopologue levels following incubation of Min6 cells in U-13C6 low glucose (U-13C6 LG, 2.8 mM) or high glucose (U-13C6 HG, 16.8 mM). (a) Total intracellular pyruvate level represented as fold change relative to U-13C6 LG condition. (b) Intracellular pyruvate isotopologues levels represented as fold change relative to its respective isotopologues levels in U-13C6 LG condition. (c) Percentage of intracellular pyruvate isotopologues within U-13C6 LG or HG condition. (d) Total intracellular acetate level represented as fold change relative to U-13C6 LG condition. (e) Intracellular acetate isotopologues levels represented as fold change relative to its respective isotopologues levels in U-13C6 LG condition. (f) Percentage of intracellular acetate isotopologues within U-13C6 LG or HG condition. Experiments were conducted three times in triplicate each time. Data was analyzed by student’s t test (2A and 2D) or by Two-way ANOVA (2B, 2C, 2E and 2F). *p < .05, **p < .01, ***p < .001 and ****p < .0001. Black bar = U-13C6 LG, white bar = U-13C6 HG.
Figure 3. Extracellular pyruvate and levels of its isotopologues following incubation of Min6 cells in U-13C6 low glucose (LG, 2.8 mM) or high glucose (HG, 16.8 mM). (a) Total extracellular pyruvate level represented as fold change relative to the U-13C6 LG condition. (b) Percentage extracellular pyruvate to total (intracellular + extracellular) pyruvate in U-13C6 LG and HG condition. (c) Extracellular pyruvate isotopologues levels represented as fold change relative to its respective isotopologues levels in U-13C6 LG condition. (d) Percentage of extracellular pyruvate isotopologues within U-13C6 LG or HG condition. Experiments were conducted three times in triplicate each time. Data was analyzed by student’s t test (3A and 3B) or by Two-way ANOVA (3C and 3D). *p < .05, **p < .01, ***p < .001 and ****p < .0001. Black bar = U-13C6 LG, white bar = U-Citation13C6 HG.
Figure 4. Extracellular acetate and levels of its isotopologues following incubation of Min6 cells in U-13C6 LG and U-13C6 HG. (a) Total extracellular acetate level represented as fold change relative to U-13C6 LG condition. (b) Percentage of extracellular acetate to total (intracellular + extracellular) acetate in U-13C6 LG and HG condition. (c) Extracellular acetate isotopologues levels represented as fold change relative to its respective isotopologues levels in U-13C6 LG condition. (d) Percentage of extracellular acetate isotopologues in U-13C6 LG and HG condition. Experiments were conducted three times in triplicate each time. Data was analyzed by student’s t test (4A and 4B) or by Two-way ANOVA (4C and 4D). *p < .05, **p < .01, ***p < .001 and ****p < .0001. Black bar = U-13C6 LG, white bar = U-13C6 HG.
Figure 5. Glucose concentration does not affect extracellular acetate incorporation into Min6 cells or intracellular/extracellular acetate levels in CD1 islets. (a) 14C acetate incorporation level of Min6 cells represented as fold change relative to LG condition. (b) Intracellular acetate of CD1 mouse islets represented as fold change relative to LG condition. (c) Concentration (µM) of extracellular acetate CD1 mouse islets. (d) Fold change of MCT1–4 expression in CD1 mice islets, liver, muscle, LG incubated Min6 cells, or HG incubated Min6 cells relative to CD islet MCT1 expression. For 5A, experiment was conducted three times in triplicate each time. For 5B and 5C, n = 3 samples, each sample has 100 ~ 200 islets. For 5D, CD1 islets, liver, and muscle, the n = 4, and for min6 LG and min6 HG, the n = 6. Data was analyzed by student’s t test (5A, 5B and 5C) and One-way ANOVA (5D), *p < .05, **p < .01, ***p < .001 and ****p < .0001. Black bar = LG, white bar = HG.

