
Figures & data
Table 1. Number of animals.
Figure 1. Schematic visualization of the antibody design. All antibodies were based on the variable domains of Bapi in yellow, with the addition of a Fab8D3 fragment in red for bispecific variants. A black box represents mutations in the CH2, reducing the effector functions; knobs-into-holes design is visually represented by a knob and a corresponding hole; a green box represents non-mutated constant region whereas a white box indicates FcRn mutation in CH3.
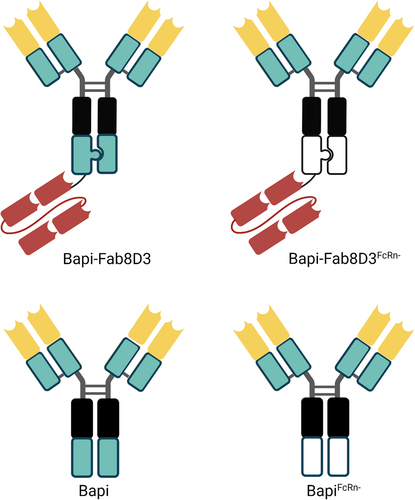
Figure 2. Quality control of the antibody constructs. A. Representative Biacore sensograms displaying monovalent TfR interaction of Bapi-Fab8D3 constructs. B. Representative Biacore sensograms displaying bivalent TfR interaction of 8D3 IgG. C. TfR ELISA analysis of bispecific antibody constructs D. Aβ ELISA analysis of bispecific antibody contructs E. Aβ ELISA analysis of monospecific antibody contructs F. Representative chromatogram of FcRn-column analysis of BapiFcRn- (purple), Bapi (blue) and positive control Omalizumab (orange).
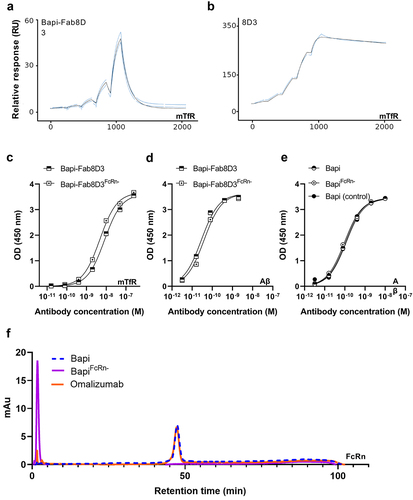
Table 2. Detailed description of antibody design and properties.
Figure 3. Ex vivo analysis of antibody distribution in WT mice. A. Antibody retention in the brain, expressed as percent of injected dose per gram (%ID/g) tissue, 3 h after injection of [125I]I-Bapi, [125I]I-BapiFcRn-, [125I]I-Bapi-Fab8D3 and [125I]I-Bapi-Fab8D3FcRn- (n = 4 per antibody). B. Blood, plasma and blood cell pellet concentration (%ID/g) 3 h after injection. C. Brain-to blood ratio 3 h post injection. D. Biodistribution, expressed as organ-to-blood concentration, 3 h after injection. E. Total blood concentration (%ID/g) of the four antibodies over a time course of seven days (n = 3–4 per antibody) with two-phase decay curve fit. F. Brain concentration (%ID/g) 7 days after injection. G. Brain-to-blood ratio seven days after injection.
![Figure 3. Ex vivo analysis of antibody distribution in WT mice. A. Antibody retention in the brain, expressed as percent of injected dose per gram (%ID/g) tissue, 3 h after injection of [125I]I-Bapi, [125I]I-BapiFcRn-, [125I]I-Bapi-Fab8D3 and [125I]I-Bapi-Fab8D3FcRn- (n = 4 per antibody). B. Blood, plasma and blood cell pellet concentration (%ID/g) 3 h after injection. C. Brain-to blood ratio 3 h post injection. D. Biodistribution, expressed as organ-to-blood concentration, 3 h after injection. E. Total blood concentration (%ID/g) of the four antibodies over a time course of seven days (n = 3–4 per antibody) with two-phase decay curve fit. F. Brain concentration (%ID/g) 7 days after injection. G. Brain-to-blood ratio seven days after injection.](/cms/asset/703a7595-62f3-4f9b-898e-974f25dcfd26/kmab_a_2339337_f0003_oc.jpg)
Figure 4. Ex vivo analysis of antibody distribution in AppNL-G-F compared to WT mice. A. Brain retention (%ID/g) of [125I]I-Bapi-Fab8D3 and [125I]I-Bapi-Fab8D3FcRn- at 12 h−168 h after injection. B. Fold difference in brain retention (AppNL-G-F/WT) at 12 h−168 h after injection of [125I]I-Bapi-Fab8D3 and [125I]I-Bapi-Fab8D3FcRn-. C. Terminal blood concentration of [125I]I-Bapi-Fab8D3 and [125I]I-Bapi-Fab8D3FcRn- in WT and AppNL-G-F mice at 12 h−168 h after injection. D. Brain-to-blood ratio of [125I]I-Bapi-Fab8D3 and [125I]I-Bapi-Fab8D3FcRn- at 12 h−168 h after injection. E. Biodistribution to peripheral organs (organ-to-blood ratio) at 24 h after injection. F. Brain retention (%ID/g) of [125I]I-Bapi and [125I]I-BapiFcRn- at 72 h after injection. G. Brain-to-blood ratio of [125I]I-Bapi and [125I]I-BapiFcRn- at 72 h after injection.
![Figure 4. Ex vivo analysis of antibody distribution in AppNL-G-F compared to WT mice. A. Brain retention (%ID/g) of [125I]I-Bapi-Fab8D3 and [125I]I-Bapi-Fab8D3FcRn- at 12 h−168 h after injection. B. Fold difference in brain retention (AppNL-G-F/WT) at 12 h−168 h after injection of [125I]I-Bapi-Fab8D3 and [125I]I-Bapi-Fab8D3FcRn-. C. Terminal blood concentration of [125I]I-Bapi-Fab8D3 and [125I]I-Bapi-Fab8D3FcRn- in WT and AppNL-G-F mice at 12 h−168 h after injection. D. Brain-to-blood ratio of [125I]I-Bapi-Fab8D3 and [125I]I-Bapi-Fab8D3FcRn- at 12 h−168 h after injection. E. Biodistribution to peripheral organs (organ-to-blood ratio) at 24 h after injection. F. Brain retention (%ID/g) of [125I]I-Bapi and [125I]I-BapiFcRn- at 72 h after injection. G. Brain-to-blood ratio of [125I]I-Bapi and [125I]I-BapiFcRn- at 72 h after injection.](/cms/asset/63990108-434e-4b71-a8e4-865d913ed9ab/kmab_a_2339337_f0004_oc.jpg)
Figure 5. Post mortem analyses of antibody brain retention 24 h after injection. A. Representative images of ex vivo autoradiography illustrating the distribution of [125I]I-Bapi-Fab8D3 and [125I]I-Bapi-Fab8D3FcRn- in sagittal brain sections from AppNL-G-F and WT mice at 24 h after antibody injection. B. Immunostaining of total Aβ (3D6) in AppNL-G-F brain with squares indicating magnified areas of abundant Aβ pathology in cortex (I) and thalamus (II). C. Nuclear track emulsion autoradiography (NTE; white puncta) in combination with immunofluorescent staining of Aβ42 (green) and endothelial cell marker CD31 (pink), 24 h after injection of [125I]I-Bapi-Fab8D3FcRn- in AppNL-G-F mice, showing antibody retention along vessels and around Aβ deposits. D. Immunofluorescent staining of AppNL-G-F mouse brain with CD31 (pink) and Aβ40 (green) demonstrating abundant Aβ40 deposition along a brain vessel.
![Figure 5. Post mortem analyses of antibody brain retention 24 h after injection. A. Representative images of ex vivo autoradiography illustrating the distribution of [125I]I-Bapi-Fab8D3 and [125I]I-Bapi-Fab8D3FcRn- in sagittal brain sections from AppNL-G-F and WT mice at 24 h after antibody injection. B. Immunostaining of total Aβ (3D6) in AppNL-G-F brain with squares indicating magnified areas of abundant Aβ pathology in cortex (I) and thalamus (II). C. Nuclear track emulsion autoradiography (NTE; white puncta) in combination with immunofluorescent staining of Aβ42 (green) and endothelial cell marker CD31 (pink), 24 h after injection of [125I]I-Bapi-Fab8D3FcRn- in AppNL-G-F mice, showing antibody retention along vessels and around Aβ deposits. D. Immunofluorescent staining of AppNL-G-F mouse brain with CD31 (pink) and Aβ40 (green) demonstrating abundant Aβ40 deposition along a brain vessel.](/cms/asset/12f38c3e-d74b-45be-88ab-c2ddb34a07f1/kmab_a_2339337_f0005_oc.jpg)