Figures & data
Figure 1. 7-bead model of antibody associations.
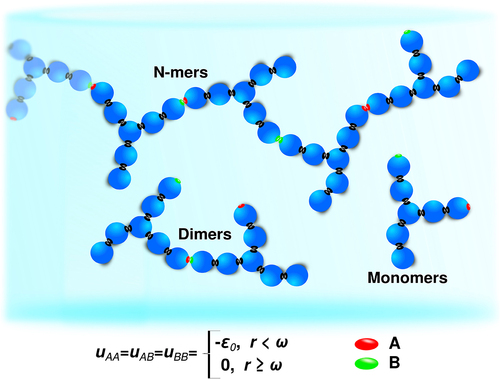
Figure 2. Viscosities as a function of antibody concentrations. In all cases the lines represent the results for the model, and the symbols were obtained experimentally. For each sample, the viscosity has been measured 10 times, the results given are arithmetic averages, the error bars approximately corresponding to the size of the symbols. All results applied to mAbs in pure water at 293 K.
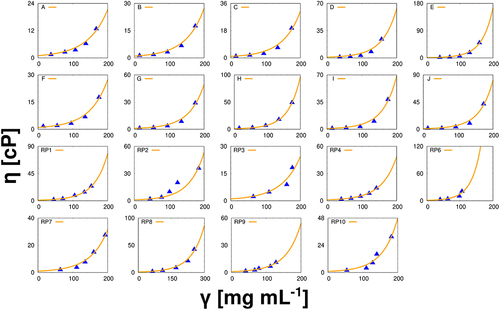
Figure 3. Cluster size distribution vs. protein concentration. Theoretical predictions for normalized mass fraction distribution of clusters of size n, P(n) for our model as a function of concentration for two mAbs (A – left, and H – right). The results for all mAbs studied here are given in SI (fig SI 2).
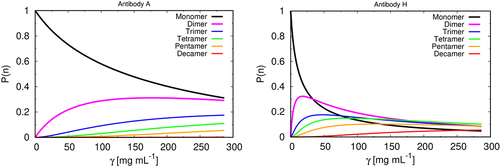
Figure 4. The relative contributions of different-sized clusters to viscosity. Predictions of the wertheim model for the relative contributions of protein monomers, dimers, 5-mers and 10-mers to the solution viscosities, vs protein concentration, for mAb A, and mAb H. The contributions to the viscosity of other size clusters (trimers to 9-mers, and higher order oligomers) are not shown in the figure.
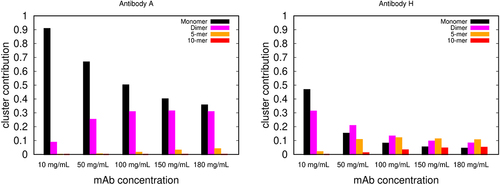
Figure 5. Lumry – Eyring plots for learning the rate-limiting steps of formation, for mAb a (left) and mAb H (right) as obtained by our model treated with wertheim perturbation theory. A forms by the ND mechanism, while H forms from the CP mechanism.
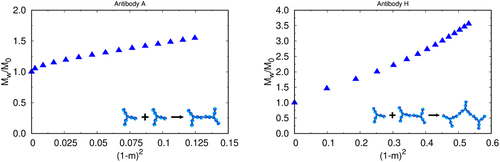
Figure 6. Solutions of lower viscosities are nucleation-rate-limited; higher viscosities are propagation limited, as determined from Lumry – Eyring plots. For mAbs A, B, F, C, RP3, RP7, and RP8, nucleation is the dominant mechanism for cluster formation. For mAbs G, D, I, J, H, E, RP1, RP2, RP4, RP6, RP9, and RP10, elongation following initial dimerization is rate limiting.
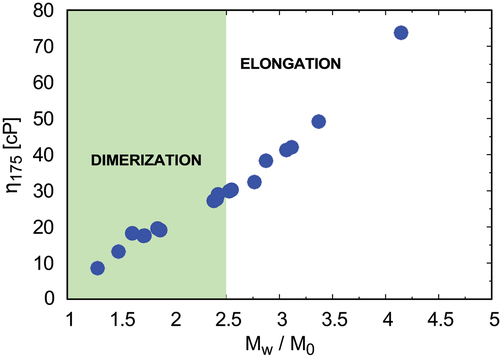
Figure 7. Left: B22 is not predictive of solution viscosities. Right: G22 is predictive. Correlations between experimental viscosities at mAb concentration 175 mg/mL. The colors indicate ranges of B22 that are experimentally considered for classification of colloidal stability of antibodies: green – repulsive, yellow – near ideal, red – attractive. For each sample, B22 has been measured in triplicates, the error bars approximately corresponding to the size of the symbols.
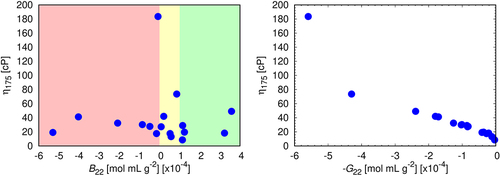
Figure 8. The correlation between experimental viscosities at mAb concentration 175 mg/mL and experimentally determined G22 coefficients at mAb concentration 80 mg/mL. For each sample, G22 has been measured in triplicates, the error bars approximately corresponding to the size of the symbols. The linear fit (red line) is represented by the equation y = −92.25x + 21.66; Pearson’s r = −0.65.
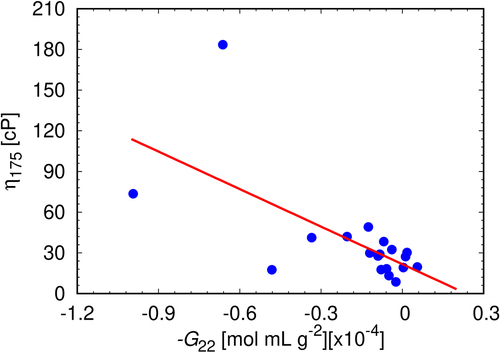
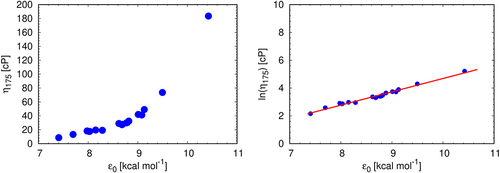
Figure 9. Solution viscosities correlate with, ε0, the protein-protein affinity of the model at mAb concentration 175 mg/mL. Pearson’s r for the right panel is 0.99.