
Figures & data
Figure 1. Schematic representation of a conventional antibody vs a camelid-derived heavy chain-only antibody. (A) Conventional antibodies are composed of two heterodimeric chains, two identical heavy chain fragments consisting of the constant heavy domains CH1-CH3 and the antigen binding variable heavy domain (highlighted in pink) and two identical light chains composed of a constant light-chain domain and a variable light chain domain (highlighted in blue). (B) HCAb antibodies are composed of two identical heavy chain-only fragments that lack a CH1 domain and only have a single variable heavy domain (VHH). (C) Ribbon representation of the crystal structure of a VHH domain (PDB: 1I3V) showing the complementary-determining loops, CDR1 in green, CDR2 in magenta and CDR3 in orange. Framework regions are shown in gray. 3D structure created using Pymol.
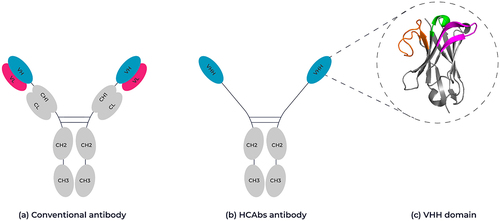
Figure 2. Structural representation of framework 2 residues in human VH and camelid VHHs. Ribbon representation of the crystal structure of (A) human VH (PDB: 7OBF) and (B) camelid-derived VHH (PDB: 1JTT) highlighting the framework 2 positions for each domain. Position 37: Human Valine, Camelid Phenylalanine (red), Position 44: Human Glycine, Camelid Glutamic acid (blue), position 45: Human Leucine, Camelid Arginine (yellow) and position 47: Human Tryptophan, Camelid Glycine (cyan); Kabat numbering. The interaction position of the human variable light chain with the human variable heavy chain is represented by the dotted line. The complementary-determining loops, CDR1 in green, CDR2 in magenta and CDR3 in orange. Framework regions are shown in gray. 3D structure created using Pymol.
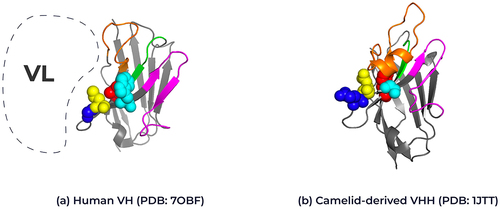
Figure 3. Overview of VHH antibody discovery methods. VHH antibodies are typically sourced from either alpacas or llamas after immunization with an antigen of choice. An alternative source can be a naive library from llamas or alpacas, or a synthetic library design using a combination of sequence and structural information. Constructed libraries can be interrogated by phage display and combined with a machine learning approach to identify key attributes for affinity, developability and function.
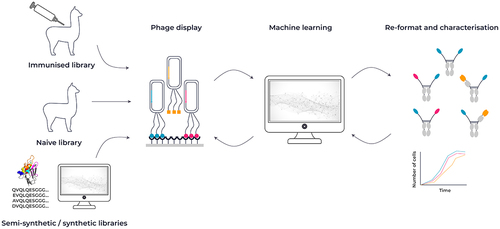
Figure 4. Targeting tumor cells co-expressing two different receptors at the cell surface (left) not co-expressed on normal cells with a multispecific VHH, thereby minimizing antibody engagement against healthy cells.
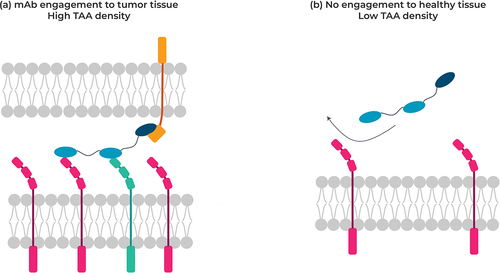
Figure 5. Topological representation of examples of clinically relevant VHH-based therapeutic bispecifics.
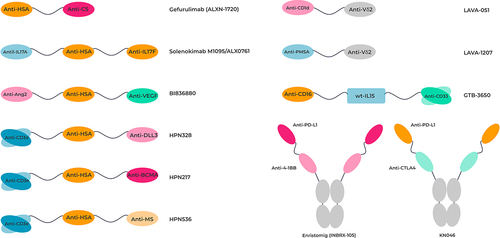
Table 1. Preclinical and clinical stage VHH-based bispecific molecules. All data correct as of 1st September 2023.
Figure 6. Overview of machine learning tools for antibodies and VHHs. (A) Tools for structural prediction, encompassing the ImmuneBuilder suite, IgFold, and Nanonet. (B) Language model-based sequence optimization with AbLang, AntiBERTy, IgLM, Sapiens and NanoBERT, alongside Bayesian Optimization techniques like AntBO and LaMBO2. Additionally, humanization tools include Hu-Mab, PLAN and CUMAb.
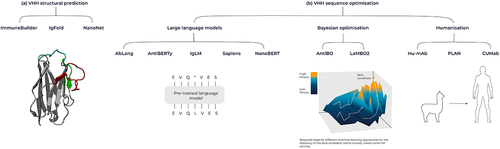
Table 2. Summary of language models applicable to antibodies and VHHs.