
Figures & data
Figure 1. Representative IEC chromatogram for the mAb DS. The red dotted lines indicate the collected fractions across the three acidic peaks, the main peak, and the basic peak. The symbols represent the product specific charge variants (CDR deamidation (square), glycation (star), LMWS (oval), N-terminal cyclization (pentagon), and HMWS). The symbols for CQAs and non-CQAs are outlined in red and black font, respectively.
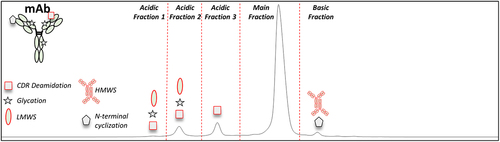
Table 1. Summary of mAb charge variant characterization.
Table 2. Summary of mAb forced degradation results.
Figure 2. (a) Linear regression analysis for CDR deamidation measured by the MAM method and the sum of acidic peaks measured by IEC for a) DP stability samples, (b) heat stress DS at 40°C, and (c) high pH stress DS (pH 8.6).
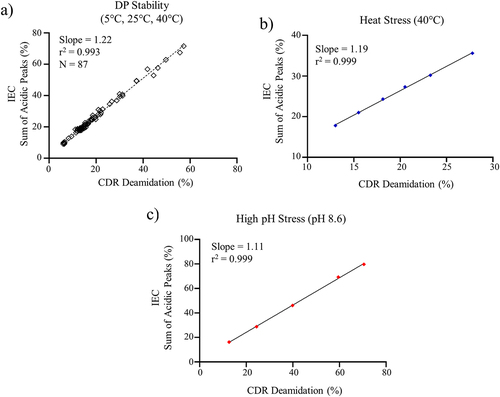
Figure 3. a) Linear regression analysis for the unmodified (non-CDR deamidation) peptide measured by the targeted MAM method and the main peak measured by IEC for a) DP stability samples, b) heat stress DS at 40°C, and c) mAb high pH stress (pH 8.6).
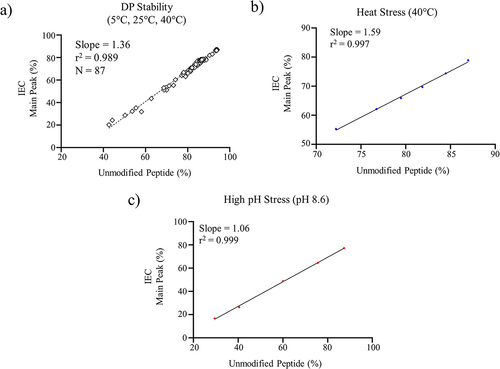
Figure 4. The correlation between HMWS measured by SE-HPLC and the sum of basic peaks measured by IEC is shown for low pH stress mAb.
