Figures & data
Figure 1. Schematic drawing of the alternative splicing construct containing four exons. Exons 1,2 and 4 are constitutive, while Exon 3 may be excluded from the mRNA as part of an alternative intron (Intron 2’). (a) If Exon 3 is included in the spliced mRNA, the light chain will be expressed (on top of the drawing). If Exon 3 is spliced out from the mRNA, heavy chain will be expressed (on the bottom of the drawing). (b) Schema of the adapted construct expressing DsRed and GFP.
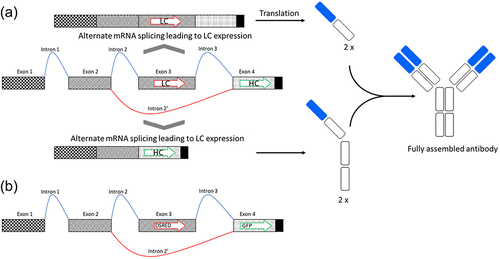
Table 1. List of constructs in pGLEX3 backbone expressing GFP and DsRed. Available constructs are indicated by a cross.
Table 2. List of constructs in pGLEX3 or pGLEX41 backbone expressing an anti-HER2 antibody. Available constructs are indicated by a cross.
Figure 2. Sequences of the Introns of the different splicing constructs used in this study. The different splice acceptor sequences parts are shown (branch point, polypyrimidine tract (poly(Y) tract), intron-exon border consensus sequence (C*)), the pyrimidines in the poly(Y) tract are highlighted in green, the sequence modifications are highlighted in red and underlined and the Start codon in Exon 3 or 4 is underlined). (a) Modifications in the splice acceptor site of Intron 2: modifications in the number of pyrimidines (Ys; the bases C and T) in the poly(Y) tract, modifications in the branch point region and modifications in the intron-exon consensus sequence. (b) Modifications in the poly(Y) tract of Intron 3. (c) Elimination of the splice donor site of cTNT-I4 located downstream of Exon 3. Shown is an alignment of the native cTNT-I4 sequence and the shortened version I4(sh), that lacks the splice donor consensus sequence (cTNT-I4 Intron is only displayed partially for better visibility).
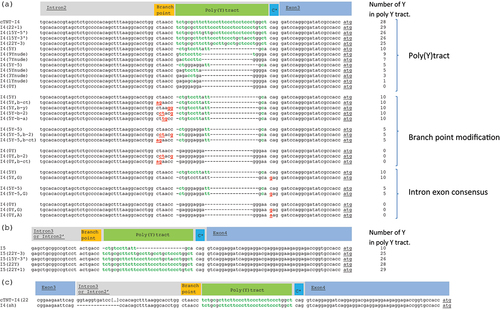
Figure 3. Heat map summarizing the optimization of the construct using fluorescent proteins in (a) CHO cells and (b) HEK293 cells. Modification of the intron arrangements allowed to shift the ratio. The cell population with Exon 3 being flanked by the same introns shows a higher level of double staining. The elimination of the splice donor site combined with the reduction of the poly(Y) tract (only performed for CHO) allowed to identify constructs with an even higher shift toward GFP expression. Every column is the mean of three individual transfections.
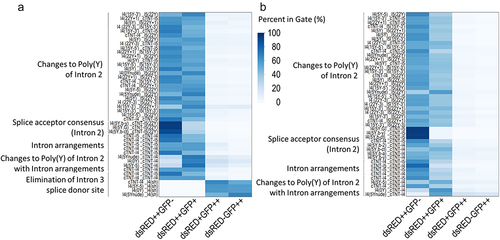
Figure 4. Anti-HER2 antibody expression with constructs having different splice ratios of mRNAs coding for subunits assembling the HER2 antibody. Expression results (“Titer”) and the splice ratio of mRNA 1 (with Exon 3) to mRNA 2 (without Exon 3) determined by ddPCR (“mRNA ratio”) are shown as a function of the orientation (light chain (LC) in Exon 3, heavy chain (HC) in Exon 4 or the other way round) and of the nature of Intron 3 (poly(Y) tract and cTNT-I4 vs cTNT-I4(sh)).
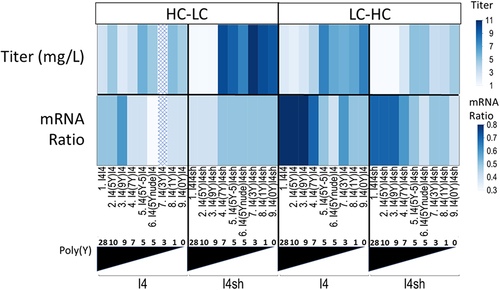
Figure 5. The alternative exon is more susceptible to splicing when flanked by identical sequences in Intron 2 and Intron 3, leading to higher levels of antibody expression. cTNT-I4 intron sequence allowed the highest expression levels.
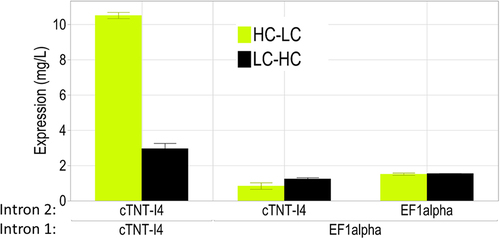
Figure 6. Cell performance of a stable CHO pool population expressing the construct with cTNT-I4(0Y) in Intron 2 and cTNT-I4 in Intron 3. Shown are the viable cell concentration (VCC), viability (both Vi-cell) and titer (Cedex) in a 14-day fed-batch in 125 mL shake flask.
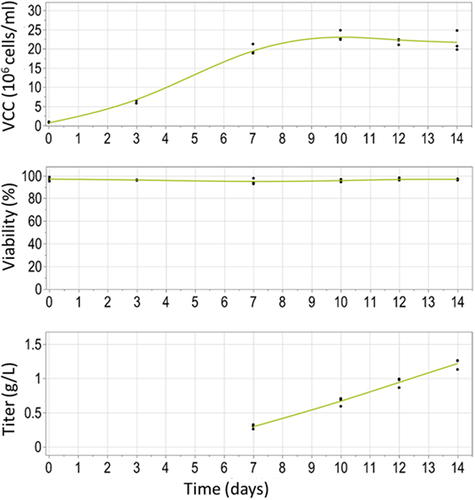
Figure 7. Intact mass measurement by mass spectrometry comparing glycosylated (a) and aglycosylated (b) anti-HER2 antibody generated using alternative splicing and glycosylated (c) and aglycosylated (d) anti-HER2 antibody generated in traditional fed-batch. The measured molecular masses matched the expected ones for the anti-HER2 antibody, with its major N-glycosylations (G0F/G1F for anti-HER2 antibody generated in traditional fed-batch and G0F/G0F for the anti-HER2 antibody generated using alternative splicing) and major post-translational modifications (C-terminal lysine clipped, Glycation), within an accepted error of ±5 Da (±50 ppm).
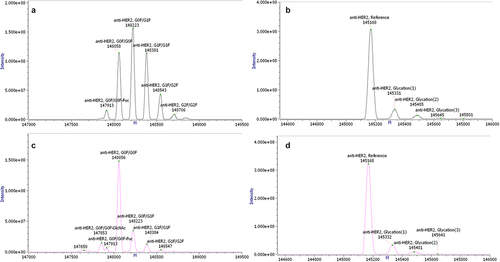
Figure 8. Stability assessment of the splice event in the stable pool population expressing cTNT-I4(0Y) in Intron 2 and cTNT-I4 in Intron 3 using ddPCR. No statistically significant difference was identified between the three timepoints.
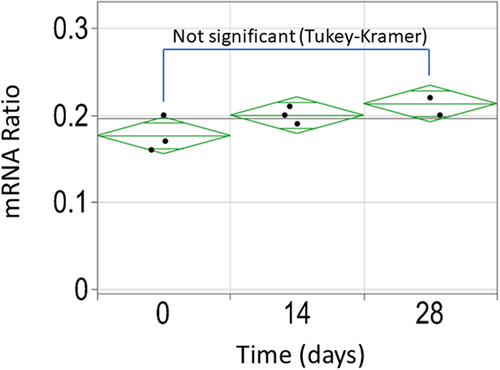
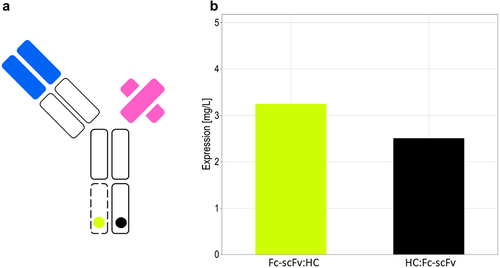
Figure 9. Expression level of the anti-CD3/anti-HER-2 bispecific antibody in transient transfection. (A) Schematic drawing of the bispecific antibody. (B) The alternative splicing construct in orientation HC:Fc-scFv (black) or in orientation Fc-scFv:HC (yellow) was co-transfected at a threefold molar excess of light chain expression vector to alternative splicing vector.