Figures & data
FIGURE 1. Sampling sites used in the analysis of Red Snapper abundance in the northern Gulf of Mexico. Depth contours are 20–500 m.
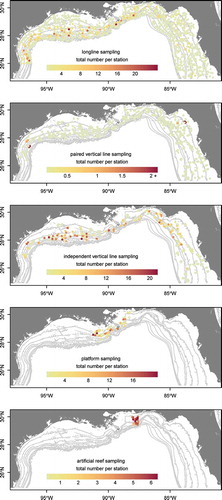
FIGURE 2. Plots of Red Snapper fork length and age frequency based on captures in five different surveys within the northern Gulf of Mexico: bottom longline (LL), vertical line paired with longline (VLpair), independent vertical line (VLind), vertical line on petroleum platform habitat (VLplat), and vertical line on artificial reef habitat (VLart). Solid black lines denote the mean length and age for each survey.
FIGURE 3. Distribution of natural habitats and artificial structures throughout the prediction domain within the northern Gulf of Mexico, as defined by the databases used in this study. Percent artificial structure influence is calculated based on the number of structures (petroleum platforms and artificial reefs) in each prediction cell multiplied by the area of assumed influence (a 100-m radius; AARZ = Alabama Artificial Reef Zone).
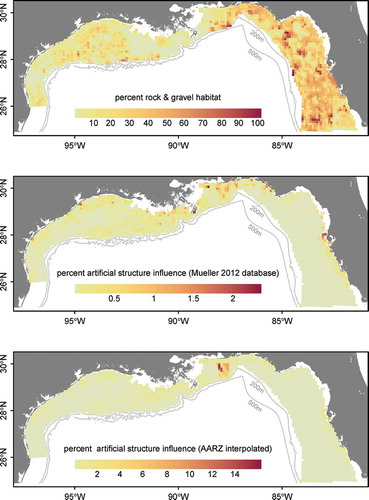
TABLE 1. Percent deviance explained by each factor in the logistic model of the probability of presence and the Poisson model of positive counts (i.e., abundance when present) for Red Snapper in the northern Gulf of Mexico.
TABLE 2. Ratio of average catch rates of Red Snapper on petroleum platform habitats or artificial reefs versus targeted natural habitats in the northern Gulf of Mexico, presented for each age-class and depth bin.
FIGURE 4. Variogram model fit used for kriging the residuals of bottom longline data set predictions from the generalized linear model of Red Snapper relative abundance.
FIGURE 5. Kriged predictions of the residual abundance and associated SEs for Red Snapper in the northern Gulf of Mexico.
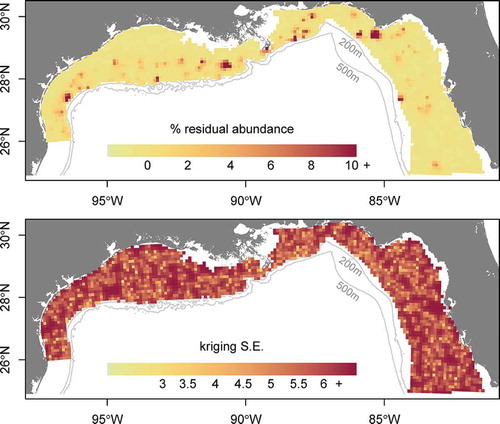
FIGURE 6. Maps of relative abundance, biomass, and fecundity (with associated SEs; see Methods) for Red Snapper in the northern Gulf of Mexico based on the generalized linear model.
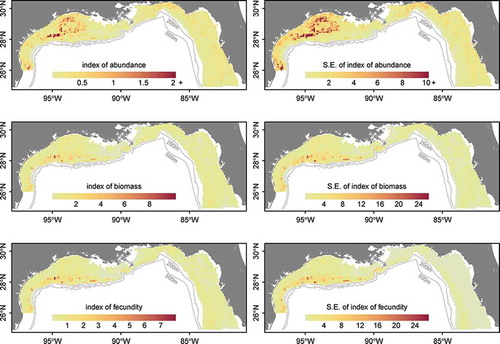
TABLE 3. Total contribution of natural habitats and artificial structures to the Gulf of Mexico Red Snapper population in terms of number, biomass, and fecundity (see Methods). Values in parentheses are results from the sensitivity analysis representing uncertainty in the number of artificial reefs.
TABLE 4. Percentage of individuals from each Red Snapper age-class that were estimated to occur on natural habitats or artificial structures, calculated across the entire northern Gulf of Mexico.
FIGURE 7. Maps of predicted relative abundance, biomass, and fecundity (see Methods) for Red Snapper in the northern Gulf of Mexico based on the generalized linear model and abundance estimates for artificial structures.
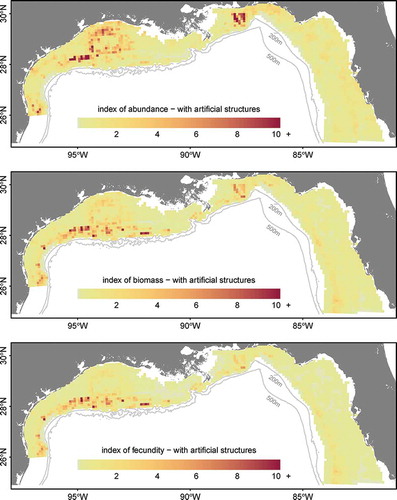
FIGURE 8. Maps of the proportion of Red Snapper relative abundance, biomass, and fecundity occurring on artificial structures in the northern Gulf of Mexico. Histograms show the distribution of the data points in each map.
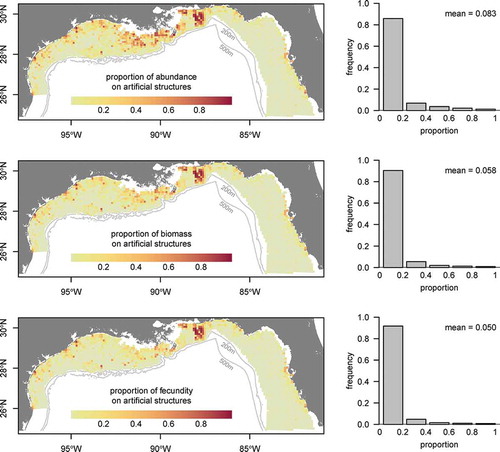
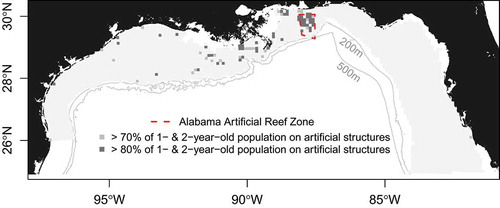
FIGURE 9. Influence of artificial structures on age-1 and age-2 Red Snapper abundance in the northern Gulf of Mexico. Grid cells highlight areas where at least 70% or 80% of the age-class is estimated to occur on artificial structures.