
Figures & data
Figure 1. The study area with the locations of the investigated sites in Istanbul and Kocaeli provinces. The green box shows the track 188 PALSAR-2 (ascending orbit). Red circles show the investigated sites kadikoy and Balcik. The location of the Yavuz Sultan Selim Bridge is also shown by the red line. The inset is the map of Turkey.
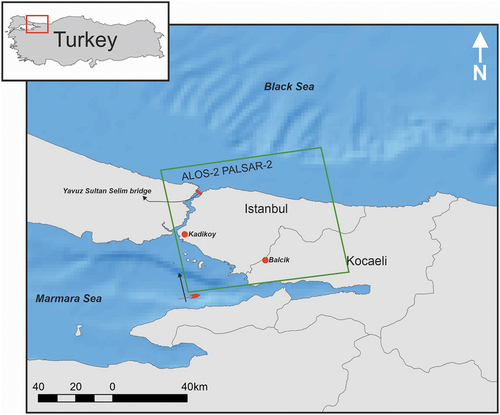
Table 1. SAR images and detailed characteristics of the L-band PALSAR-2 dataset used in this study. “*” indicates super master image, “A” indicates ascending orbit, respectively.
Figure 2. Flowchart of the proposed research.
Figure 3. Scatter plots and correlation coefficients (CCs) of the intensity pixel values of the PALSAR-2 images with respect to the super master image (2016.06.26) in Kadikoy.
Figure 4. Scatter plots and correlation coefficients (CCs) of the intensity pixel values of the PALSAR-2 images with respect to the super master image (2016.06.26) in Balcik.
Figure 5. (a) SBAS SAR network of the analysis for the PALSAR-2 images (black dots). The super master image is highlighted by a yellow dot; (b) arrangement of InSAR pairs and the corresponding pair number over each link.
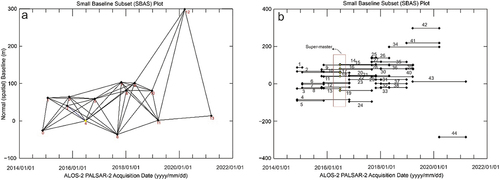
Figure 6. (a) Histogram of coherence values for different pairs in Kadikoy; (b) histogram of coherence values for different pairs in Balcik.
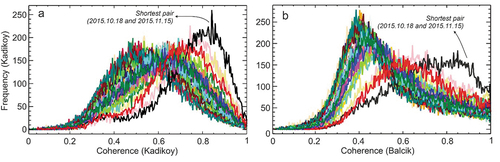
Figure 7. Mean vertical velocity map of Istanbul and Kocaeli. Black dashed polygons are mainly landslide areas or forest. The black rectangles are Kadikoy and Balcik.
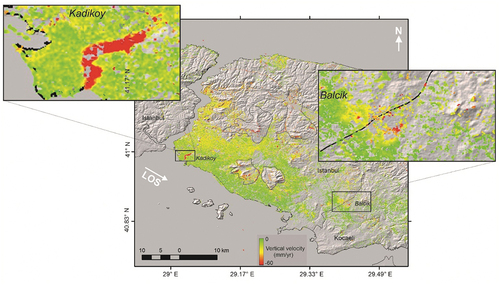
Figure 8. (a) Kadikoy buildings overlaid on the mean vertical velocity (MVV) map; (b) roads overlaid on the MVV map; (c) railways overlaid on the MVV map. The locations of field observations and the water canal (blue polygon) are shown by the numbers in (c).
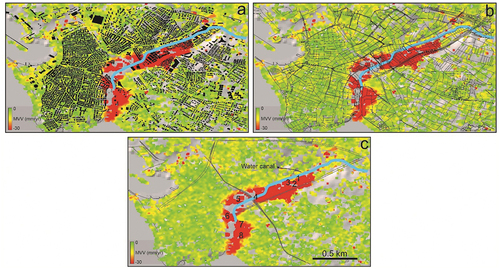
Table 2. Detailed information of affected length of railways and roads in PALSAR-2 and Sentinel-1 displacement maps.
Figure 9. (a) Balcik buildings overlaid on the mean vertical velocity (MVV) map; (b) roads overlaid on the MVV map. The locations of field observations are shown by the numbers in (b).
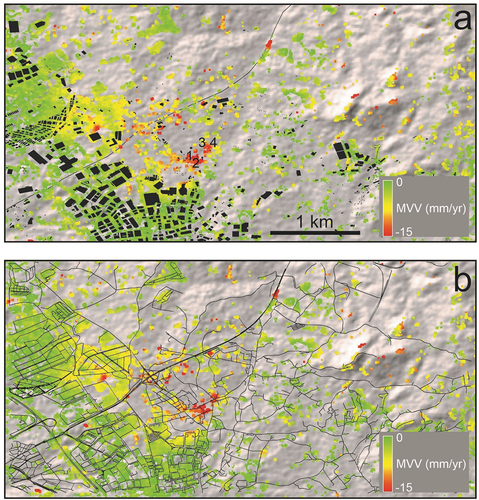
Figure 10. Subsidence evidence in different locations in the Kadikoy region. The locations of the images are shown in figure 8(c).
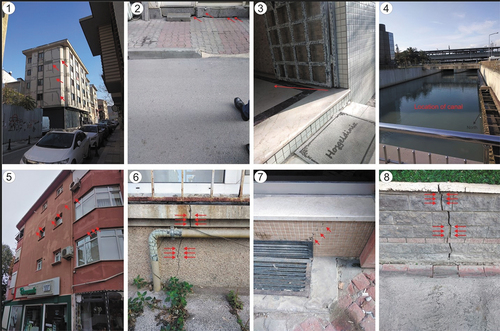
Figure 11. Subsidence evidence in different locations in the Balcik region. The locations of the images are shown in figure 9(a).
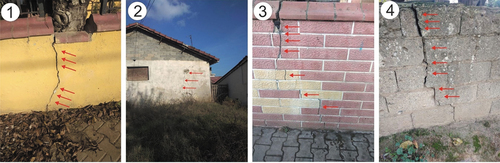
Figure 12. (a) Sentinel-1 mean vertical velocity in the Kadikoy region; (b) scatter plot of mean vertical velocities.
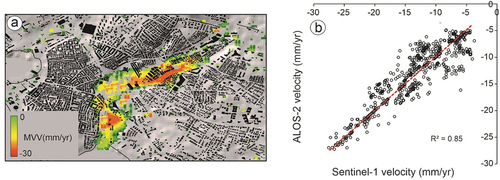
Table 3. Geographic coordinates of the observed areas in Kadikoy and Balbik (see locations in and ).
Figure 13. (a) Statistical results of coherence changes for the SAR pairs with a time interval near to one year for Kadikoy and (b) for Balcik.
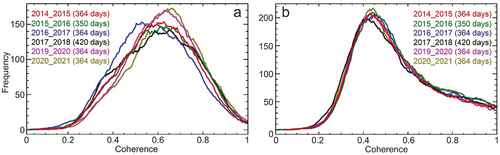
Figure 14. (a-d) RGB color composite for SBAS coherence pairs with one-year time spans.
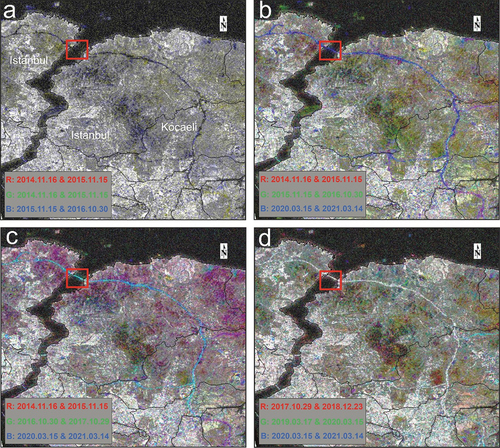
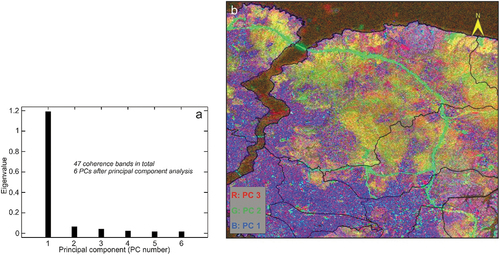
Figure 15. (a) Principal components (PCs) for the coherence pairs. Red box shows the location of Yavuz Sultan Selim Bridge; (b) RGB color composite of the first three PCs.
Supplementary_document_Table_A1.docx
Download MS Word (14.3 KB)Data availability statement
The data that support the findings of this study are available on request from the corresponding author.