Figures & data
Figure 1. Candida albicans overgrowth induced the disorder of the gut microbiota of bacteria.
(a) The rarefaction curve was based on the Observed OTUs. (b) Alpha diversity was evaluated by the Chao1, Observed OTUs, Pielou evenness, and Shannon index. (c) Beta diversity was measured by principal coordinate analysis (PCoA). (d) The distribution plot of relative abundance at the phylum level. (e) The heat map of relative abundance at the genus level. (f) The Venn diagram of the Amplicon Sequence Variants (ASVs) between groups. (g) The histogram of taxa with LDA scores more than 4 and P value less than 0.05. (h) The volcano plot of the dominant bacterial genus between groups.
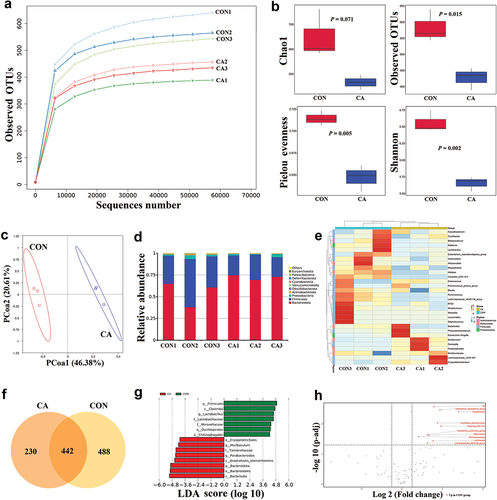
Figure 2. Candida albicans overgrowth induced the disorder of gut microbiota of fungi.
(a) The rarefaction curve was based on the Observed OTUs. (b) Alpha diversity was evaluated by the Chao1, Observed OTUs, Pielou evenness, and Shannon index. (c) Beta diversity was measured by PCoA. (d) The distribution plot of relative abundance at the phylum level. (e) The heat map of relative abundance at the genus level. (f) The Venn diagram of the ASVs between groups. (g) The histogram of taxa with LDA scores more than 4 and P-value less than 0.05. (h) The volcano plot of the dominant fungal species between groups.
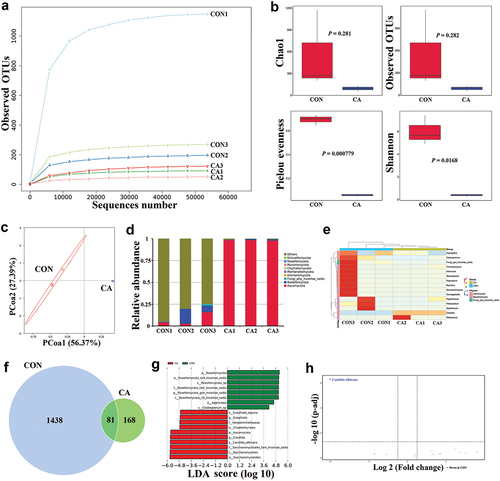
Figure 3. In vivo γδT cell neutralisation partly rescued the bacterial dysbiosis but aggravated the fungal dysbiosis caused by Candida albicans overgrowth.
(a) The rarefaction curve for 16S sequencing was based on the Observed OTUs. (b) Alpha diversity was evaluated by the Chao1, Observed OTUs, Pielou evenness, and Shannon index. (c) Beta diversity was measured by PCoA. (d) The distribution plot of relative abundance at the phylum level. (e) The heat map of relative abundance at the genus level. (f) The histogram of taxa with LDA scores more than 4 and P value less than 0.05. (g) The volcano plot of the dominant bacterial genus between the CA and ATG groups. (h) The rarefaction curve for ITS sequencing was based on the Observed OTUs. (i) Alpha diversity was evaluated by the Chao1, Observed OTUs, Pielou evenness, and Shannon index. (j) Beta diversity was measured by PCoA. (k) The distribution plot of relative abundance at the phylum level. (l) The heat map of relative abundance at the genus level. (m) The histogram of taxa with LDA scores more than 3 and P value less than 0.05. (n) The boxplot of the differential fungal species between the CA and ATG groups.
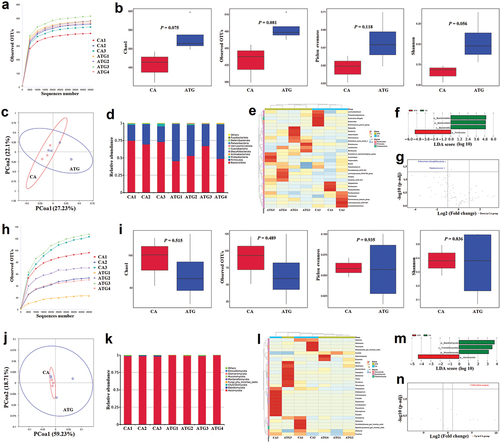
Figure 4. In vivo IL-17A neutralisation aggravated the microbial dysbiosis caused by Candida albicans overgrowth.
(a) The rarefaction curve for 16S sequencing was based on the Observed OTUs. (b) Alpha diversity for 16S sequencing was evaluated by the Chao1, Observed OTUs, Pielou evenness, and Shannon index. (c) Beta diversity for 16S sequencing was measured by PCoA. (d) The distribution plot of relative bacterial abundance at the phylum level. (e) The heat map of relative bacterial abundance at the genus level. (f) The histogram of bacterial taxa with LDA scores more than 4 and P value less than 0.05 between the CA and AIL groups. (g) The volcano plot of the dominant bacterial genus between the CA and AIL groups. (h) The rarefaction curve for ITS sequencing was based on the Observed OTUs. (i) Alpha diversity for ITS sequencing was evaluated by the Chao1, Observed OTUs, Pielou evenness, and Shannon index. (j) Beta diversity for ITS sequencing was measured by PCoA. (k) The distribution plot of relative fungal abundance at the phylum level. (l) The heat map of relative fungal abundance at the genus level. (m) The histogram of fungal taxa with LDA scores more than 4 and P value less than 0.05 between the CA and AIL groups. (n) The histogram of the differential fungal species between the CA and AIL groups.
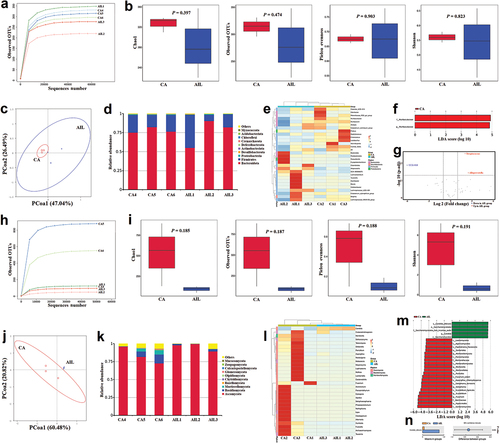
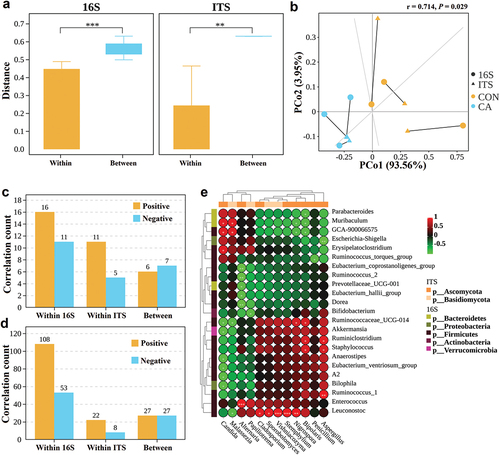
Figure 5. Significant correlations between fungal and bacterial kingdoms were found in the gut microbiome during Candida albicans overgrowth.
(a) Box plot of the Bray-Curtis distance between samples in the same group (within the CON group or the CA group) and between samples in different groups (between the CON and CA groups) for 16S and ITS sequencing data. Bray-Curtis dissimilarity values range from 0 to 1, with 0 being the least dissimilar and 1 being the most dissimilar. Wilcoxon test, **P < 0.001, ***P < 0.0001. (b) Procrustes test depicting the significant correlation between gut bacterial community and fungal community based on Bray-Curtis dissimilarity metrics (Class level, sum of squares M2 = 0.4896, r = 0.714, P = 0.029, 999 permutations). (c and d) Bar graph of the significant correlation count for intra-bacteria (within 16S), intra-fungi (within ITS), and inter-kingdom (between) in family level (c) and genus level (d) based on Spearman correlations (with an absolute correlation value > 0.5 and P < 0.05). (e) Heatmap of the correlations between bacteria and fungi in genus level based on Spearman correlations. *P < 0.05, **P < 0.001, ***P < 0.0001.