
Figures & data
Figure 1. Sampling site and culture of Cladophialophora brunneola (CGMCC 3.18770). (a) Landscape of sampling site. (b) Rocks bearing black colonies. (c) Colony on 2% MEA after 4 weeks. (d–h) Conidial chains. (i, j) Conidia. Scale bars = 10 µm.
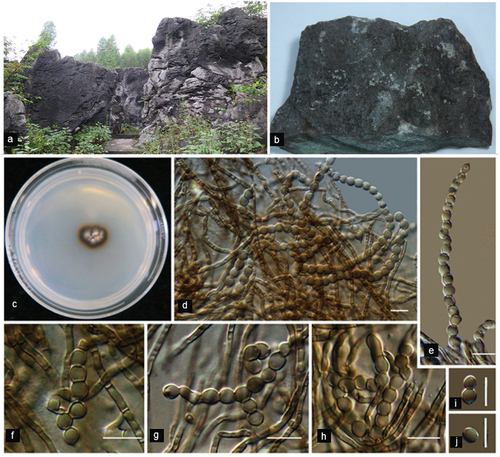
Table 1. Characteristics of genome assembly of Cladophialophora brunneola..
Figure 2. Phylogenetic tree of the Cladophialophora genus generated using maximum likelihood analysis with combined of ITS, SSU, and LSU sequences. Node values (ML/BI) indicating bootstrap support (left) and Bayesian posterior probability (right) are shown. Sequences generated in this study are highlighted in orange. The outgroup used in this analysis is Cyphellophora europaea strain CBS 129.96.
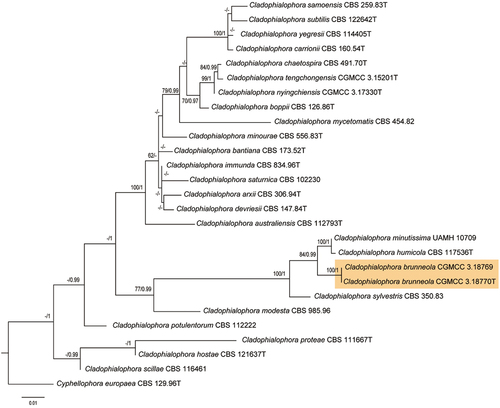
Figure 3. Circos graph illustrating genome characteristics of Cladophialophora brunneola. (a) 25 scaffolds (>100 kb) representing over 93.83% of the assembled genome, with large fragment duplications marked. Transposons are shown in green and retrotransposons are shown in purple. (b) GC ratio per 100 kb. (c) Secondary metabolite BGCs indicated by red arrows. (d) Gene density per 100 kb.
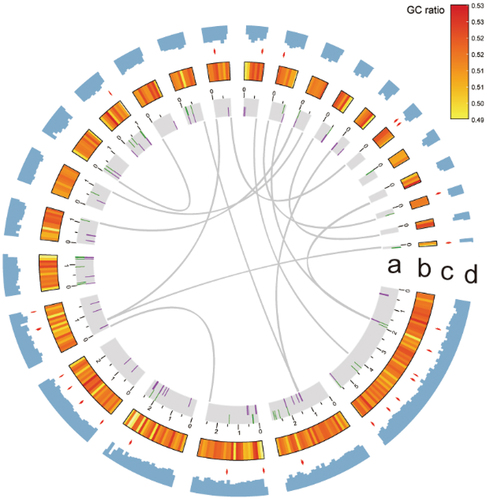
Figure 4. Phylogenomic relationships among representatives from Herpotrichiellaceae, trichomeriaceae, and cyphellophoraceae species. The tree was rooted using species in Dothideomycetes as outgroup. Three rock-inhabiting fungi (RIF) are highlighted in red. Genes were categorised as core (present in all species), shared (present in at least two species), and species-specific.
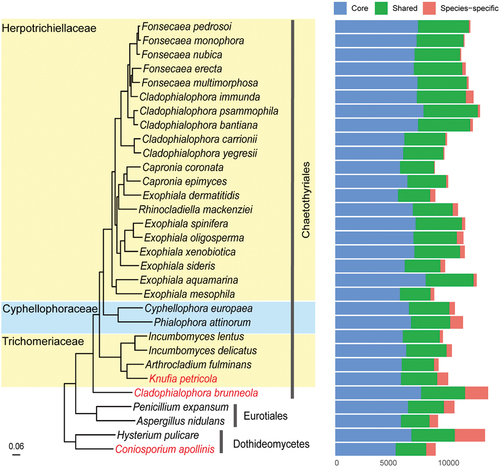
Figure 5. KOG functions of genes in whole genome and species-specific in Cladophialophora brunneola.
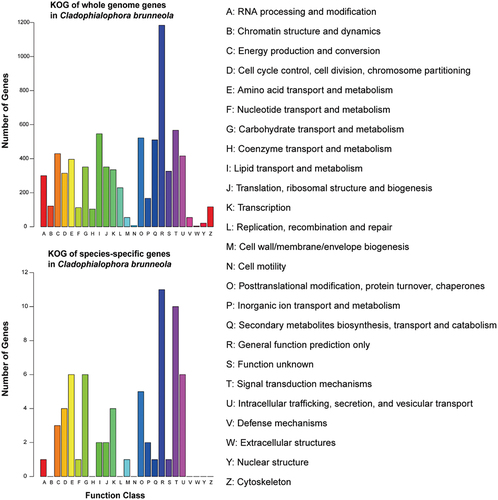
Table 2. Comparison of CAZymes between RIF and saprophytes.
Table 3. Comparison of secondary metabolite BGCs between RIF and saprophytes.
Figure 6. (a) Melanin accumulation and hyphal morphology of Cladophialophora brunneola in liquid culture, scale bars = 10 µm. (b) UV-Vis absorption curve of crude melanin extraction (200–800 nm). (c) Absorption value at 220 nm of crude melanin extraction from samples treated with varying PEG concentrations.
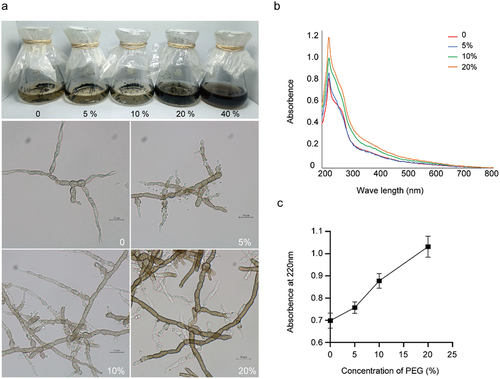
Figure 7. (a) Pairwise Pearson correlation coefficients comparing the transcriptome data of control (CK) and PEG-treated (P) samples in Cladophialophora brunneola. (b) Volcano plots illustrating differentially expressed genes (DEGs) between control and PEG-treated samples.
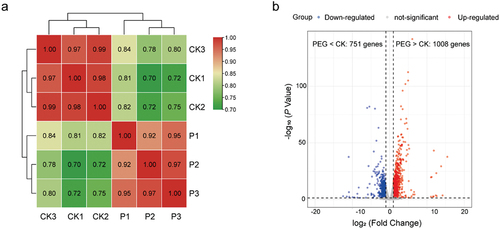
Figure 8. Gene expression levels in melanin synthesis pathways of Cladophialophora brunneola. (a) DHN-melanin pathway. (b) DOPA-melanin pathway. (c) L-tyrosine degradation pathway.
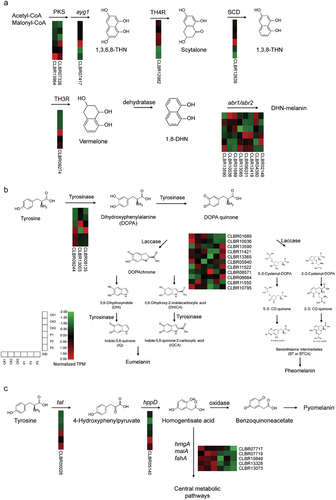
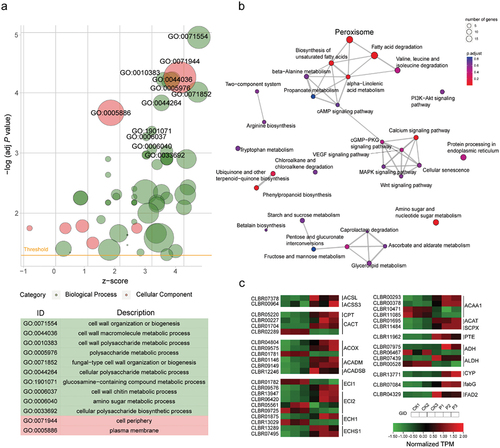
Figure 9. (a) GO enrichment plot of different expression genes (DEGs) in Cladophialophora brunneola, with z-score calculated as (number of upregulated genes – number of downregulated genes) divided by the square root of the number of genes in a specific GO term. (b) KEGG pathway enrichment of DEGs. (c) Expression level of genes involved in fatty acid degradation and biosynthesis.
Supplemental Material
Download Zip (1.2 MB)Data availability statement
The sequencing data are available at NCBI BioProject ID PRJNA952342.