Figures & data
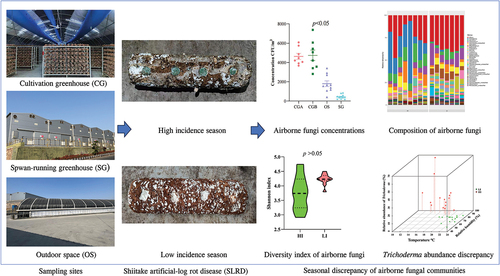
Figure 1. Sampling sites and time in the shiitake factory.
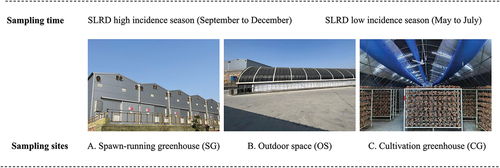
Figure 2. Differences of airborne fungal concentrations in the four sampling sites during shiitake artificial log rot disease (SLRD) high and low incidence seasons. (a) and (b) Represented the differences in airborne fungal concentrations of the four sampling sites [cultivation greenhouse A (CGA), cultivation greenhouse B (CGB), outdoor space (OS), and spawn-running greenhouse (SG)] in SLRD high and low incidence seasons, respectively. (c–f) Represented the difference in airborne fungal concentrations between high and low incidence seasons in CGA, CGB, OS, and SG, respectively.
![Figure 2. Differences of airborne fungal concentrations in the four sampling sites during shiitake artificial log rot disease (SLRD) high and low incidence seasons. (a) and (b) Represented the differences in airborne fungal concentrations of the four sampling sites [cultivation greenhouse A (CGA), cultivation greenhouse B (CGB), outdoor space (OS), and spawn-running greenhouse (SG)] in SLRD high and low incidence seasons, respectively. (c–f) Represented the difference in airborne fungal concentrations between high and low incidence seasons in CGA, CGB, OS, and SG, respectively.](/cms/asset/e90b5b72-03fb-4990-8b58-16ea4b0baf5c/tmyc_a_2323714_f0002_oc.jpg)
Figure 3. Relative abundances of airborne fungi in different sampling sites at genus level. Cultivation greenhouse a (CGA) (a), cultivation greenhouse B (CGB) (b), spawn-running greenhouse (SG) (c), and outdoor space (OS) (d) respectively. Different colors represent the different fungal genera and the height of the column represents the relative fungal abundance.
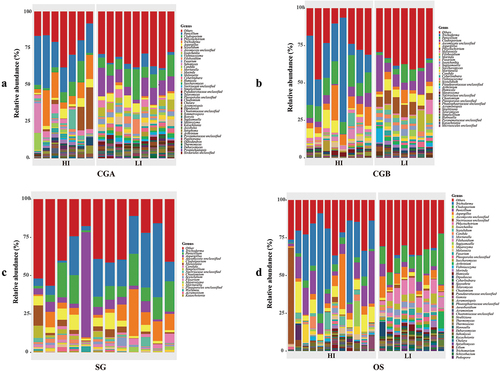
Figure 4. The Shannon and Chao1 indices of cultivation greenhouse a and b (CGA, CGB) and outdoor space (OS) in high and low incidence seasons. Difference of Shannon index between high and low incidence seasons in CGA (a), CGB (b), and OS (c) respectively; difference of Chao1 index between high and low incidence seasons in CGA (d), CGB (e), and OS (f), respectively.
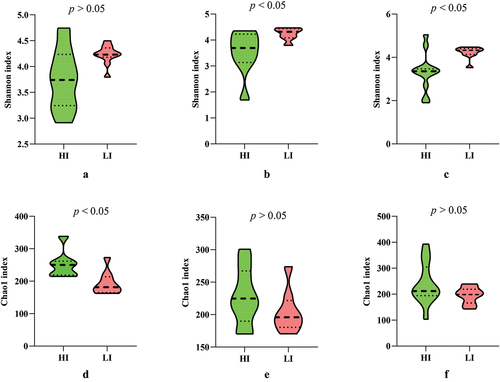
Table 1. Similarity analysis of samples between different groups.
Figure 5. Distribution of relative abundance of Trichoderma, temperature, and relative humidity in high and low incidence seasons in the cultivation greenhouses.
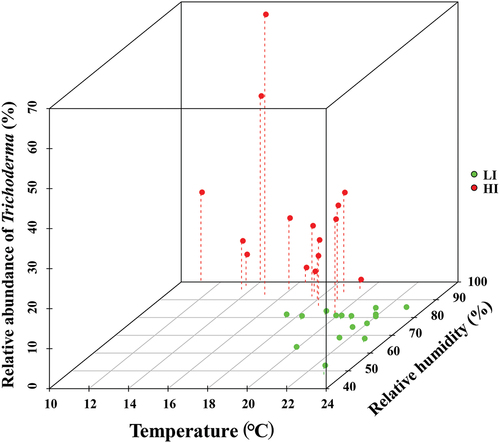
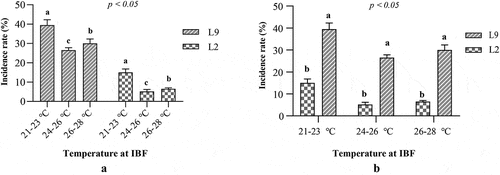
Figure 6. Shiitake artificial log rot disease (SLRD) incidence of two Lentinula edodes varieties under different temperatures. Difference of incidence rate of SLRD under different interval period between two fruiting flushes (IBF) temperature (a); difference of incidence rate of different L. edodes varieties at the same IBF temperature (b).