Figures & data
Figure 1. Structural comparison of Ctf1 and Mrr2. (a) Primary and secondary structure of Ctf1 and comparison of the amino acid sequences of Ctf1 with Mrr2. Ctf1 consists of 822 amino acids with 35 α-helices (H1-H35) and 2 β-folds (S1 and S2); Mrr2 consists of 405 amino acids; BLAST, E:6.8e-16 indicates the homologous sequence. (b) Protein structural modelling of Ctf1. The centre is a highly conserved zinc finger structure containing an intermediate homology region on the outside. Bold yellow lines (BLAST, E:6.8e-16) indicate the homologous sequence.
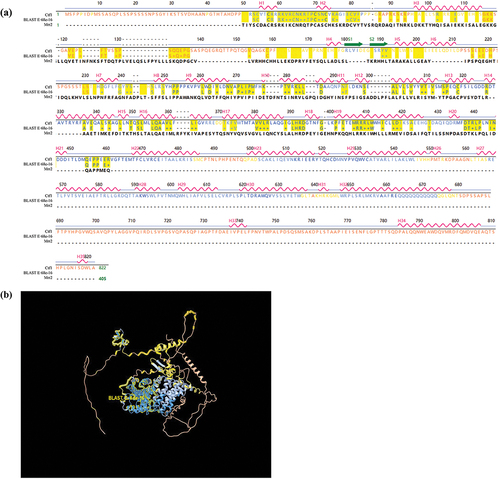
Figure 2. Growth of the strains. (a) Colonies in CZA dishes after incubation at 37 °C for 48 h. (b) Morphology of the strains observed under the microscope after fluorescent staining (×100). (c) Comparison of colony diameters after 48 h of incubation at 37 °C in CZA dishes. (d) Comparison of spore numbers after 48 h of incubation at 37 °C in CZA dishes. ***p < 0.001; **p < 0.01; *p < 0.05; ns, p > 0.05.
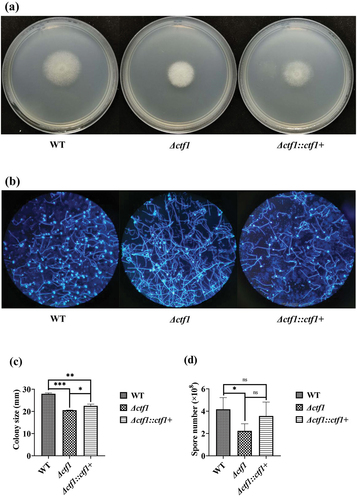
Figure 3. E-test. Each of the three strains was incubated in 1640 solid medium containing azole reagent strips for 48 h at 35 °C. The ctf1 gene-deficient strains displayed decreased sensitivity to VOR, but no significant change in sensitivity to ITR and POS.
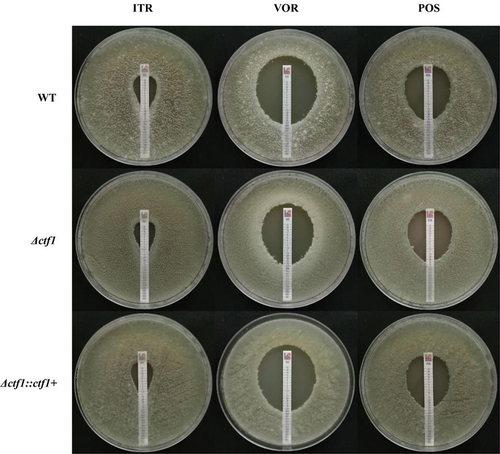
Table 1. Effect of ctf1 on the susceptibility of triazole antifungal drugs in vitro.
Figure 4. Analysis of DEGs in WT and Δctf1 transcriptomes. (a) Volcano plot of all detected genes. The transcriptome results identified 2,547 genes with upregulated expression and 2,516 genes with downregulated expression. (b) KEGG pathway analysis of DEGs showed that 35 DEGs were mainly involved in “ABC transporters”. Most genes (61.57%) affected by ctf1 were associated with fungal metabolism. (c) The expression of differential genes in pathways associated with metabolism.
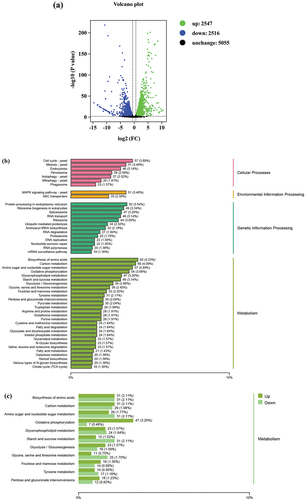
Figure 5. qPCR analysis. The expression levels of mdr1, mdr2, and mdr4 were significantly elevated in Δctf1 compared to WT. Data were analysed by using the 2−ΔΔCT method. ***p < 0.001.
Figure 6. Comparison of the ergosterol content in the three strains. Colonies in SDA dishes after incubation at 37 °C for 72 h. The sterols of the fungus were extracted with n-heptane. The absorbance at 240 nm to 300 nm was measured and the ergosterol content was quantified by using the formula (Percentage of ergosterol content ). The ergosterol content of the knockout strain was significantly higher compared to WT and was largely restored after reintroduction of the ctf1. ***p < 0.001; ns, p > 0.05.