Figures & data
Figure 1. Far-western blotting of human nasopharynx cell and PsaA. (a) SDS-PAGE of whole cell lysate of human nasopharynx cell (Detroit 562) was probed with biotinylated PsaA. (b). Far- western blot analysis of whole cell lysate proteins of human Detroit 562 cell probed with biotinylated PsaA. A specific interaction between PsaA and whole proteins was detected by a streptavidin bead conjugated with HRP and visualized by x-ray film exposure. A protein spot from approximately 35 kDa (arrow) was excised from Coomassie stained gel and analyzed by electrospray ionization-tandem mass spectrometry for protein identification. Based on isoelectric point and molecular weight summarized in the table, human annexin A2 was identified as a putative receptor of PsaA. Amino acid sequences of human ANXA2 identified from mass spectrometry were underscored.
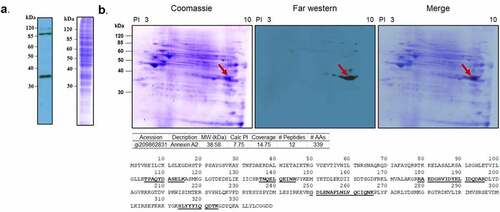
Figure 2. Expression of ANXA2 in murine respiratory tissues.
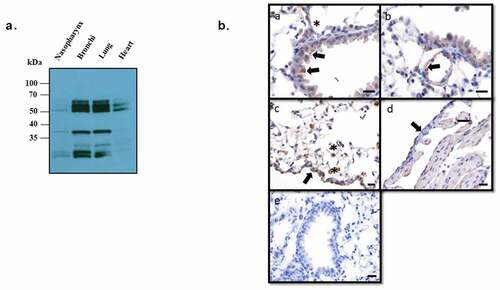
Figure 3. Western blotting probed with monoclonal ANXA2 antibody from mouse. (a) Four different cell lines (Detroit 562, A549, HEK 293 T/17 mock, and ANXA2 transduced HEK 293 T/17) were probed with ANXA2 antibody to detect the ANXA2 expression. Size difference could be due to lentiviral expressed plasmid containing Myc-DDK tag and multiple cloning regions. (b) Secondary only antibody control western blotting to confirm the nonspecific signal. (c) The purified ANXA2 by nickel chromatography from cell culture medium of ANXA2 transduced HEK293 T/17 cells.
Figure 4. Binding of S. pneumoniae T4R to HEK 293 T/17 expressing ANXA2. HEK 293 T/17 expressing ANXA2 or Mock cells were incubated with S. pneumoniae T4R wild type (a) and at MOI of 1 for 30 min. After washing, the numbers of S. pneumoniae T4R bound to HEK 293 T/17 cells were determined by plate counts (b) T4R ΔPsaA at MOI of 1 for 30 min. After washing, the numbers of S. pneumoniae T4R bound to HEK 293 T/17 cells were determined by plate counts. (c) To determine the effect of blocking ANXA2 on binding of S. pneumoniae T4R to HEK 293 T/17 expressing ANXA2, HEK 293 T/17 expressing ANXA2 or Mock cells were incubated with recombinant PsaA (200 µg/ml) for 60 min. After washing, the numbers of S. pneumoniae T4R bound to HEK 293 T/17 cells were determined by plate counts. Experiments were performed three times in triplicate. Data shown are the mean ±SD. Asterisk indicates the statistical significance of student t-test at P < 0.05.
Figure 5. Binding of recombinant ANXA2 to S. pneumoniae T4R. A recombinant ANXA2 20 µg (a) or 100 µg (b) was incubated with S. pneumoniae T4R, followed by incubation with fluorescein isothiocyanate-conjugated anti-ANXA2 antibody. Binding of ANXA2 to S. pneumoniae T4R was assessed by flow cytometry. As a control, S. pneumoniae T4R was incubated with fluorescein isothiocyanate-conjugated anti-ANXA2 antibody. Percentages shown are percent of the total population positive for FITC as compared to secondary only antibody control with each different amount of recombinant ANXA2. Data are representative of at least three replicate experiments.
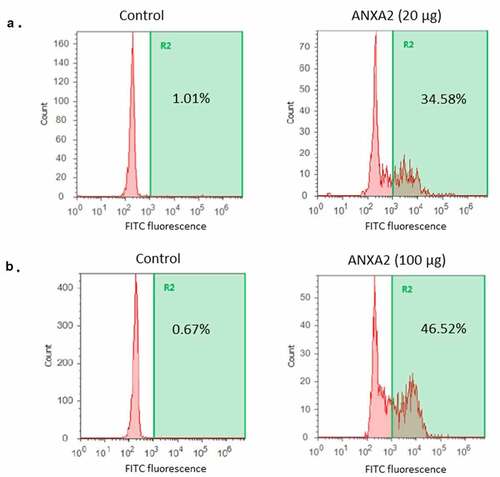
Figure 6. Size-exclusion chromatography (SEC) of PsaA (blue), ANXA2 (red) and the 1:1 mixture (green) of both proteins. (a) SEC was performed with PsaA, ANXA2 (HEK293 T/17), and a 1:1 mixture after incubating each for 1 hr at 25°C respectively. (b) Data was performed with PsaA, ANXA2 (E. coli), and a 1:1 mixture after incubating each for 1 hr at 25°C respectively. (c, d) Same proteins as (A) and (B), but incubation occurred for 1 hr at 37°C. The long leading edge in panels (c) and (d) likely originates from fast exchanging, interacting species following incubation.
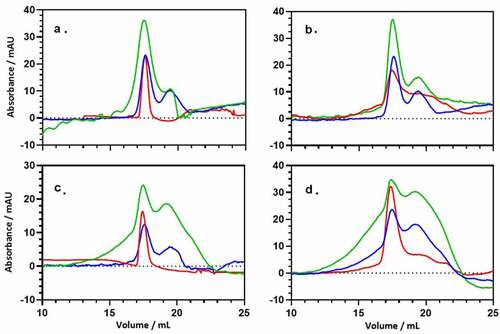
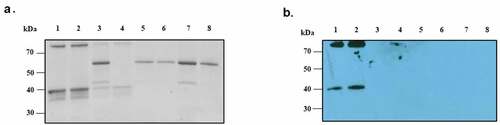
Figure 7. Direct binding interaction between recombinant ANXA2 and PsaA. The bound recombinant ANXA2 or BSA to protein-bound beads or no proteins-beads were separated on SDS-PAGE gel and stained with Coomassie blue G-250 (a) and replicated gel was transferred to PVDF membrane and probed with anti-ANXA2 antibody (C-10) by western blot (b). Bound ANX2 to PsaA-beads (lane 1), bound ANXA2 to PsaA (Mn)-beads (lane 2), bound ANXA2 to BSA-beads (lane 3), bound ANXA2 to no proteins-beads (lane 4), bound BSA to PsaA-beads (lane 5), bound BSA to PsaA (Mn)-beads (lane 6), bound BSA to BSA-beads (lane 7), and bound BSA to no proteins-beads (lane 8).