
Figures & data
Figure 1. Establishing a model of ADE in DENV-3 infected THP-1 cells
At 48 h post-infection, supernatant (A) and cells (B) were collected for total RNA, and then DENV-3 genome RNA was detected using RT-qPCR. Then, THP-1 cells were collected for total protein at 48 h post-infection, the Western blotting (C) and Immunofluorescence (D) were used to detect intracellular DENV-3 E protein. The 1640(-) represents dilution of DENV-3 with RPMI-1640 medium without Anti- Dengue -II PrM antibody as negative control.
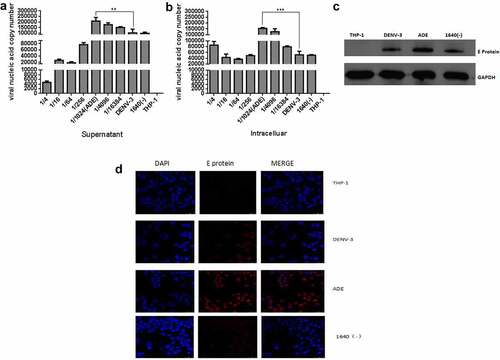
Table 1. Transcriptome sequencing data quality assessment
Figure 2. Transcriptome sequencing data quality assessment
The integrity of RNA was detected by gel agarose gel electrophoresis (A).
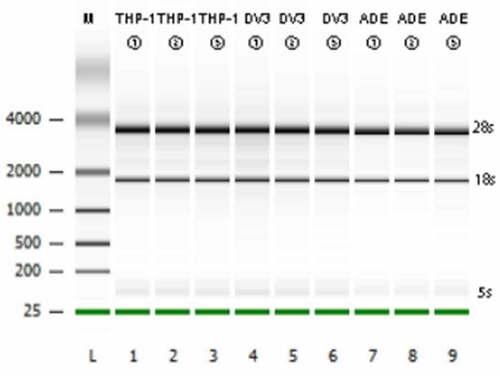
Figure 3. DE circRNAs expression profile
DE circRNAs chart of THP-1 VS DENV-3 (A), THP-1 VS ADE (B) and DENV-3 VS ADE (C). Up-regulated circRNAs were blue and down-regulated circRNAs were red.
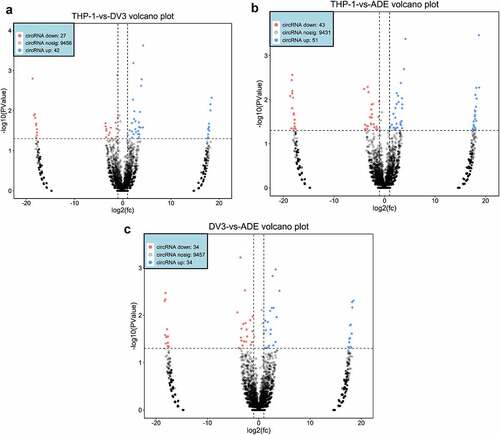
Figure 4. Differentially expressed mRNAs and miRNAs profiles
DE mRNAs in THP-1 VS DENV-3 (A), THP-1 VS ADE (B), and DENV-3 VS ADE (C). Up-regulated mRNAs were blue and down-regulated mRNAs were red. DE miRNAs in THP-1 vs DENV-3 (D), THP-1 vs ADE (E) and DENV-3 vs ADE (F). Up-regulated miRNAs were red and down-regulated miRNAs were green.
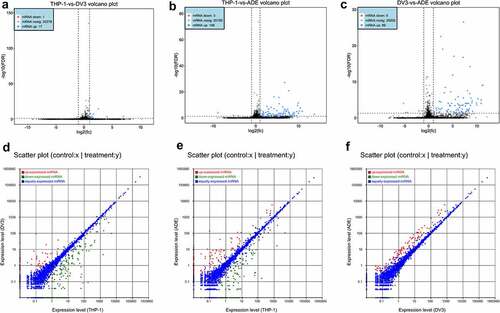
Figure 5. GO and KEGG analysis of DE RNAs
GO analysis of DE circRNAs in THP-1 vs DENV-3 (A), THP-1 vs ADE (B), and DENV-3 vs ADE (C), respectively. GO analysis of DE miRNAs in THP-1 vs DENV-3 (D), THP-1 vs ADE (E), and DENV-3 vs ADE (F). GO analysis of DE mRNAs in THP-1 vs DENV-3 (G), THP-1 vs ADE (H), and DENV-3 vs ADE (I).
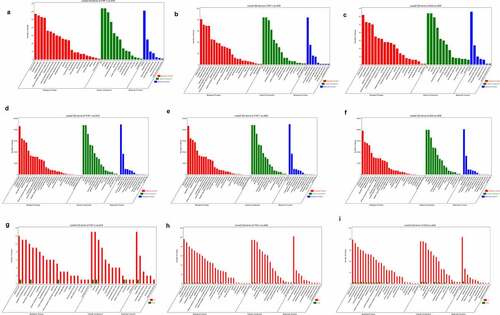
Figure 6. Quantitative real-time PCR analysis and Prediction of small peptide coding ability of circRNA encoded by host gene
The qRT-PCR confirm DE RNAs in THP-1 vs DENV-3 (A), THP-1 vs ADE (B), and DENV-3 vs ADE (C). Confirmation of DE circRNAs head-jail junction sequence and prediction of small peptide coding ability of novel_circ_001562 (D).
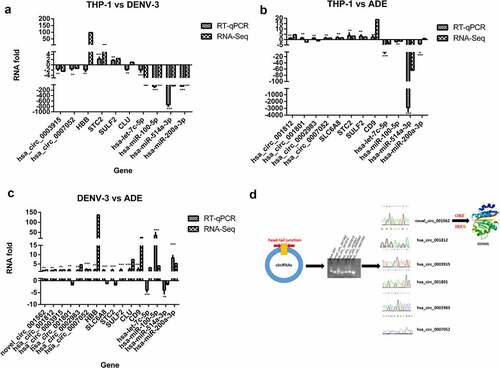
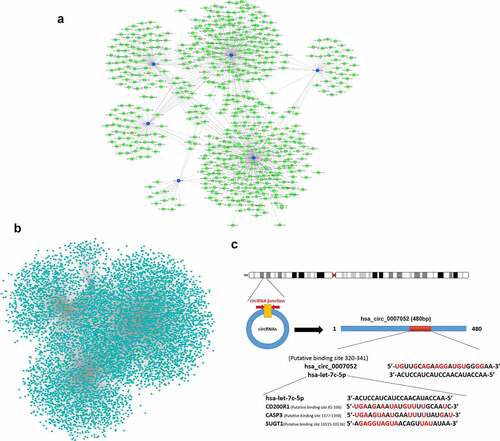
Figure 7. Differentially expressed CircRNAs- miRNAs- mRNAs interaction network
DE CircRNAs- miRNAs regulatory network (A). DE CircRNAs were blue dots, DE miRNAs were green dots. DE miRNAs- mRNAs regulatory network (B). DE miRNAs were green dots, and DE mRNAs were blue dots. CeRNA co-expression network (C). The red base represents complementary pairing with microRNA (hsa-let-7 c-5p).
Supplemental material
Supplemental Material
Download Zip (6.7 MB)Data availability statement
In this study, those data are available from the corresponding author based on reasonable requests.