
Figures & data
Figure 1. The effect of ASFV pS273R on the signaling activity of exogenous porcine cGAS-STING pathway. (a) HEK293T cells in 96-well plates (2 × 10⁴ cells/well) were co-transfected with 20 ng cGAS-HA and 10 ng STING-mCHERRY, plus 10 ng ISRE-luc or IFNβ-luc or NF-κΒ-luc and 0.2 ng pRL-TK plasmid, along with 10 ng 3×FLAG-pCMV-S273R or control vector, which were normalized to 50 ng/well by control vector. at 24 h post-transfection, luciferase activities were detected using Double-Luciferase Reporter Assay. (b,c) HEK293T cells in 24-well plates (3 × 10⁵ cells/well) were co-transfected with 400 ng cGAS-HA and 400 ng STING-mCHERRY plasmids together with 400 ng 3×FLAG-pCMV-S273R or control vector for 24 h, then the cells were harvested and analyzed by RT-qPCR for downstream gene expressions (B) and Western blotting using the indicated antibodies (c). the densitometry values of p-TBK, p-IRF3 and ISG56 proteins after normalization were shown on top of the corresponding bands.
Figure 2. The effect of ASFV pS273R on endogenous porcine cGAS-STING signaling pathway. (a) PAMs in 96-well plates (2 × 10⁴ cells/well) were co-transfected with 10 ng ISRE-luc or NF-κΒ-luc and 0.2 ng pRL-TK plasmids along with 20 ng 3×FLAG-pCMV-S273R or control vector, which were normalized to 50 ng/well by control vector. After 24 h, the cells were not or transfected with polydA:dt (0.5 μg/mL, 1 μg/mL) or 2’3’-cGAMP (1 μg/mL, 2 μg/mL) for 8 h. the luciferase activities were detected using Double-Luciferase Reporter Assay. (b–d) PAMs in 24-well plates (3 × 10⁵ cells/well) were co-transfected with 1 μg 3×FLAG -pCMV-S273R or control vector for 24 h and then transfected with polydA:dt (1 μg/mL) (b) or 45bp dsDNA (1 μg/mL) (c) or 2’3’-cGAMP (2 μg/mL) (D) for 8 h.The harvested cells were measured by RT-qPCR for downstream gene expressions as indicated. (e-f) PAMs in 24-well plate (3 × 10⁵ cells/well) were co-transfected with 1 μg 3×FLAG-pCMV-S273R or control vector for 24 h and then transfected with polydA:dt (1 μg/mL) or 2’3’-cGAMP (5 μg/mL) for 8 h. the harvested cells were detected by Western blotting with the indicated antibodies. the densitometry values of p-TBK, p-IRF3 and ISG56 proteins after normalization were shown on top of the corresponding bands.
Figure 3. The effect of ASFV pS273R on nuclear translocations of IRF3 and NF-κB p65. the PAMs grown on the coverslips in 24-well plates (1 × 10⁵ cells/well) were transfected with (a) IRF3-GFP (0.5 μg) and pCAGGS-S273R-2 HA (0.5 μg) or control vector (0.5 μg), (b) p65-GFP (0.5 μg) and pCAGGS-S273R-2 HA (0.5 μg) or control vector (0.5 μg) using Lipofectamine 2000. at 18 h post translation, the cells were stimulated with transfection of 2’3’-cGAMP (1 μg/ml) for another 6 h. the cells on coverslips were sequentially probed with rabbit anti-HA mAb, goat anti-rabbit IgG H&L Alexa Fluor 594, counter-stained with nucleus marker DAPI. the stained cells on coverslips were visualized by fluorescence microscope. the statistical analysis of the ratios of IRF3-GFP and p65-GFP in nuclear fractions vs cytoplasmic fractions were each shown on the right.
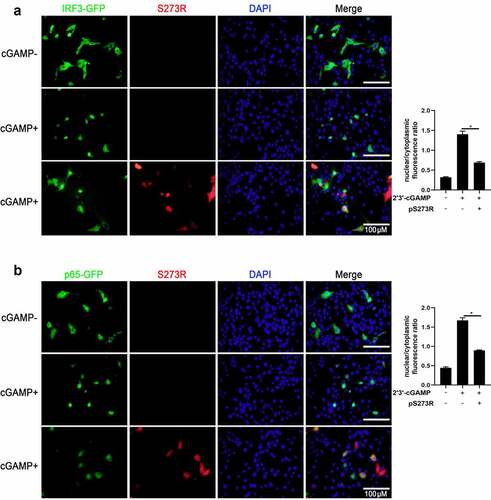
Figure 4. ASFV pS273R interfered the cGAS-STING signaling mediated anti-HSV-1 activity. (a,b) PAMs in 24-well plates (3 × 10⁵ cells/well) were co-transfected with 1 μg 3×FLAG-pCMV-S273R or control vector for 24 h and then infected with .01 MOI or .1 MOI HSV-1-GFP for 36 h, the GFP signals were observed by fluorescence microscopy (a). the infected cells were harvested to measure the GFP protein expressions by Western blotting with the normalized densitometry values of GFP proteins shown on top of the corresponding bands. (b). (c) PAM cells in 6-well plates (8 × 10⁵ cells/well) were co-transfected with 2 μg 3×FLAG-pCMV-S273R or control vector for 24 h and then infected with .01 MOI or .1 MOI HSV-1-GFP for 36 h, the GFP cells in infected PAMs were analyzed by flow cytometry. (D) the infected cells were harvested to measured HSV-1 gB gene and cellular gene transcriptions by RT-qPCR. (E) the viral titer in the supernatant from HSV-1 infected PAMs was measured by TCID50 assay.
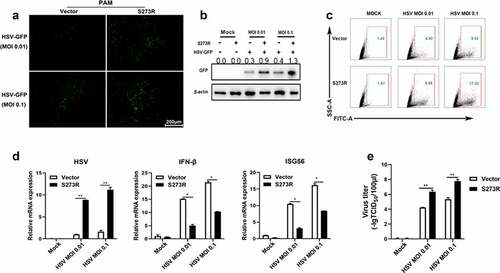
Figure 5. pS273R inhibited cGAS-STING signaling mediated anti-VSV function. (a) PAMs in 24-well plates (3 × 10⁵ cells/well) were co-transfected with 1 μg 3×FLAG-pCMV-S273R or empty vector for 24 h and then infected with .001 MOI or .01 MOI VSV for 16 h. the GFP signals were observed by fluorescence microscopy. (b) PAM cells in 6-well plates (8 × 10⁵ cells/well) were co-transfected with 2 μg 3×FLAG-pCMV-S273R or control vector for 24 h and then infected with .001 MOI or .01 MOI VSV for 16 h, the GFP cells in infected PAMs were analyzed by flow cytometry. (c–g) the infected cells were harvested to measured VSV glycoprotein gene (c) and cellular gene transcriptions (e,f) by RT-qPCR. the viral titer in the supernatant from VSV infected PAMs was measured by TCID50 assay (d) and plaque assay (g).
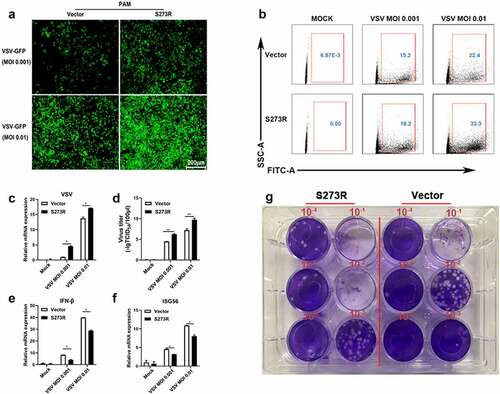
Figure 6. The identification of IKKε as the cellular target by ASFV pS273R. (a–e) HEK293T cells were co-transfected with 20 ng TBK1 expression plasmids and 10 ng 3×FLAG-pCMV-S273R (a), with 20 ng IKKε expression plasmid and increased amounts of pS273R (10 ng or 20 ng) (b), with 20 ng IRF3-5D expression plasmid and 10 ng pS273R (b), with 20 ng IKKβ plasmid and 10 ng pS273R (d), with 20ng p65 plasmid and 10 ng pS273R (e), plus 10 ng ISRE-luc, IFNβ-luc or NF-κB-luc and 0.2 ng pRL-TK plasmids, which were normalized to 50 ng/well by vector 3×FLAG-pCMV. After 24 h, the luciferase activities were detected using Double-Luciferase Reporter Assay. (f,g) pS273R plasmid (400 ng or 800 ng) were co-transfected with 400 ng IKKε into HEK293T cells. After 24 h, the cells were harvested and analyzed by RT-qPCR (f) and Western blotting (g). (h-j) the IKKε plasmid (500 ng) were co-transfected with 500 ng pS273R plasmid or empty vector into 293T cells for 24 h, then the transfected 293T cells were infected with 0.01 MOI or .1 MOI HSV-1-GFP for 36 h, the GFP signals were observed by fluorescence microscopy (H). the infected cells were harvested to measure the HSV-1 gene expression by RT-qPCR (i). the viral titer in the supernatant from HSV-1 infected 293T cells was measured by TCID50 assay (j).
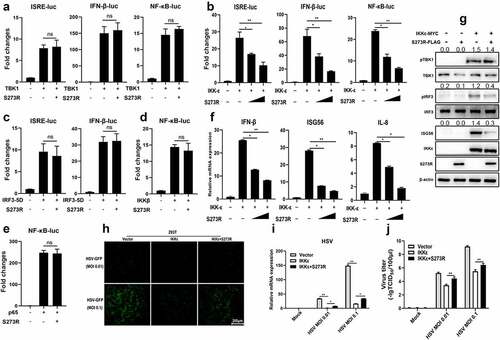
Figure 7. pS273R interacted with IKKε and disturbed the interaction between IKKε and STING. (a–c) HEK293T cells in 6-well plates (8 × 10⁵ cells/well) were co-transfected with 1 μg each plasmid as indicated for 48 h and then the cells were harvested and subjected for Co-IP using the indicated antibodies and subsequent Western blot analysis. (d) Increasing amounts of pS273R plasmid (1 μg, 2 μg) were co-transfected with 1 μg STING-mCHERRY and 1 μg IKKε-MYC into 293T cells for 48 h and then cells were harvested and immunoprecipitated with anti-mCHERRY antibody and subjected to Western blot analysis. (E) PAM cells in 24-well plates (3 × 10⁵ cells/well) were co-transfected with STING-GFP (0.5 μg) and IKKε-MYC (0.5 μg), with STING-GFP (0.5 μg) and pS273R-HA (0.5 μg), with IKKε-MYC (0.5 μg) and pS273R-HA (0.5 μg) for 24 h, and then cells were fixed and examined for cellular co-localization by con-focal microscopy. the co-localizations in multiple vision fields were analyzed using Image J, and the Pearson coefficient values from 10 positive cells were graphed and shown on the right. the value of Pearson coefficient reflects the level of co-localization, with 1 representing 100% co-localization.
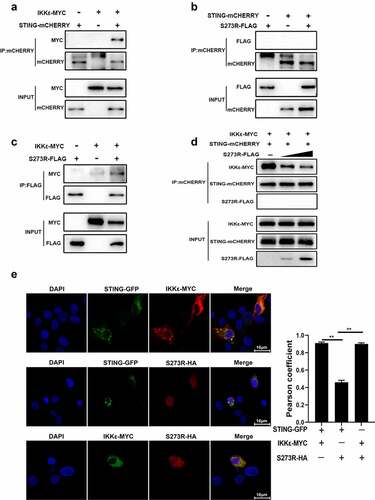
Figure 8. pS273R mutants without protease activity had decreased suppression on IKKε of cGAS-STING pathway. (a) HEK293T cells were co-transfected with 1 μg of each pS273R mutants plus wild type (WT), respectively, and then the cells were harvested and analyzed by Western blotting. (b) HEK293T cells in 96-well plates (2 × 10⁴ cells/well) were co-transfected with 20 ng cGAS-HA and 10 ng STING-mCHERRY, plus 10 ng ISRE-luc or IFNβ-luc or NF-κΒ-luc and 0.2 ng pRL-TK plasmid, along with 10 ng pS273R WT or pS273R mutants, which were normalized to 50 ng/well by vector pCAGGS. at 24 h post-transfection, luciferase activities were detected using Double-Luciferase Reporter Assay. (C) HEK293T cells were co-transfected with 20 ng IKKε, plus 10 ng ISRE-luc or IFNβ-luc or NF-κΒ-luc and 0.2 ng pRL-TK plasmid, along with 10 ng pS273R WT or pS273R mutants, which were normalized to 50 ng/well by vector pCAGGS. After 24 h, luciferase activities were measured. (D) Each pS273R mutants (1 μg) and WT were co-transfected with STING-mCHERRY (1 μg) and IKKε-MYC (1 μg) into 293T cells for 48 h, and then the cells were harvested and subjected for Co-IP using anti-mCHERRY antibody and subsequent Western blot analysis.
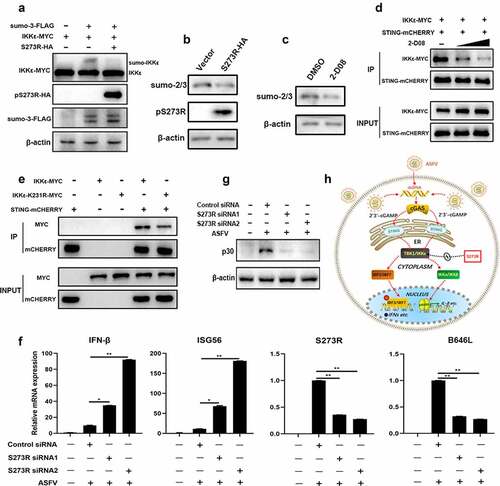
Figure 9. The inhibitory effect of pS273R on IKKε sumoylation and the role of pS273R in ASFV caused IFN evasion. (a) HEK293T cells in 24-well plates (3 × 10⁵ cells/well) were co-transfected with 300 ng IKKε-MYC and 300 ng 3×FLAG-pCMV-sumo-3 plasmids together with 300 ng S273R-HA or control vector for 24 h, then the cells were harvested and analyzed by Western blotting using the indicated antibodies. (b) HEK293T cells in 6-well plates (8 × 10⁵ cells/well) were transfected with 1 μg pS273R plasmid or vector control for 24 h, and then the cells were harvested and subjected for Western blot analysis. (c) HEK293T cells in 24-well plate were treated with 2-D08 (50 μM) or DMSO control for 18 h, followed by Western blotting with anti-sumo2/3 antibody. (d) HEK293T cells in 6-well plates (8 × 10⁵ cells/well) were co-transfected with STING-mCHERRY (1 μg) and IKKε-MYC (1 μg) for 24 h and then treated with 2-D08 (50 μM, 100 μM) for 18 h. the cells were harvested and subjected for Co-IP using anti-mCHERRY antibody and subsequent Western blot analysis. (e) IKKε-MYC and K231R mutant (1 μg each) plus STING-mCHERRY (1 μg) were transfected into 293T cells for 48 h, and then the cells were subjected for Co-IP using anti-mCHERRY antibody and subsequent Western blot analysis. (f,g) Primary PAMs (1 × 10⁶ cells/well) were transfected with siRNA for 24 h and then infected with 0.01 MOI ASFV for another 72 h. the cells were harvested for RT-qPCR analysis of the indicated gene transcriptions (f) and Western blot analysis of ASFV p30 protein (g). (h) the schematic diagram of ASFV pS273 antagonism on IKKε of cGAS-STING signaling pathway.
Supplemental Material
Download Zip (6.6 MB)Data availability statement
Data available within the article or its supplementary materials.