
Figures & data
Figure 1. Methyltransferase motifs restrict the intercellular spread of NDV. (a) Difference of infectious centre area induced by rSG10 and mutant viruses. DF-1 cells were infected by rSG10 and mutant viruses. The relative infectious centre area of rSG10-K1756A and rSG10-G1780A were compared with that of rSG10. P values were calculated with a two-way ANOVA; n = 50; ****, P < 0.0001. (b) Assessment of the mainly intercellular spread mechanism of NDV. Vero cells were infected with each strain. Viral titres were quantified as the TCID50. The NDV positive serum dilution was 1:2. The experiment was performed in triplicate.
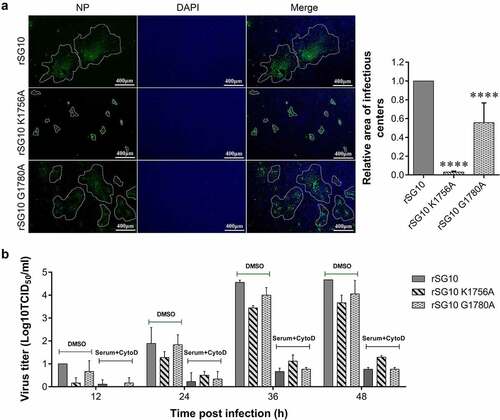
Figure 2. Detection of the adsorption, internalization and release ability of rSG10 and mutant viruses. (a – b) DF-1 cells were infected by each virus at an MOI of 10 or 0.01, BSR-T7/5 and Vero cells were infected at an MOI of 1 or 0.01 (viral titres in BSR-T7/5 cells and vero cells were lower than those in DF-1 cells and an MOI of 1 is the highest dose that can be achieved). The adsorption levels were detected as described in the materials and methods. (c – d) DF-1 cells were infected by each virus at an MOI of 10 or 0.01, BSR-T7/5 and Vero cells were infected at an MOI of 1 or 0.01. Internalization was detected as described in the materials and methods. (e – h) Cells were infected by each virus at different MOIs. The release levels were detected as described in the materials and methods. The Y-axis was defined as the ratio of the supernatant TCID50 to the lysed cell TCID50. P values were calculated with a two-way ANOVA; n = 3; ns, not significant; *, P < 0.05; **, P < 0.01; ***, P < 0.001; ****, P < 0.0001. All experiments were performed in triplicate.
Figure 3. Detection of the fusion activity of rSG10 and mutant viruses. (a) Vero cells were infected by each virus at an MOI of 0.01. The cells were fixed with absolute methanol and stained with Giemsa solution. (b) Syncytium areas in (a) were analysed at different time points using Image J software, n = 100. (c) the syncytium area of rSG10 was defined as 1 in (a). The syncytium areas of rSG10-K1756A and rSG10-G1780A were compared with that of rSG10. (d) BSR-T7/5 cells were infected by each virus at an MOI of 0.01. The cells were fixed with absolute methanol and stained with Giemsa solution. (e) Syncytium areas in (d) were analysed at different time points using Image J software, n = 100. (f) the syncytium area of rSG10 was defined as 1 in (d). The syncytium areas of rSG10-K1756A and rSG10-G1780A were compared with that of rSG10. P values were calculated with a two-way ANOVA; n = 100; ns, not significant.
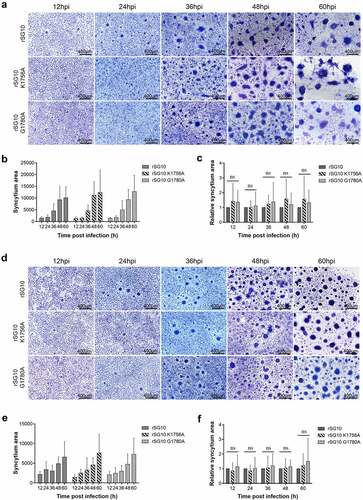
Figure 4. NDV can spread directly from cell-to-cell. (a) Schematic of the donor and target system. (b) Cell viability after treatment with positive serum at different dilutions. X-axis indicates serum dilutions. The NC group was set as a control, to which positive serum was not added. P values were calculated with an ordinary one-way ANOVA; n = 3; ****, P < 0.0001. (c) Percent infection was defined as the percentage of EGFP-only-positive target cells normalized to the percentage of double-positive donor cells. The NDV positive serum dilution was 1:2. The percent infection of the control was defined as 100%. P values were calculated with a paired t-test; n = 3; ***, P < 0.001.
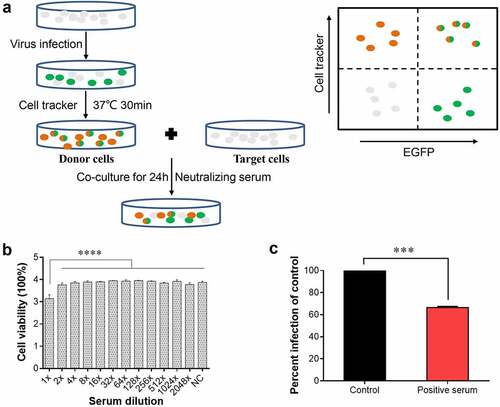
Figure 5. Mutation in the K-D-K-E motif restricts cell-to-cell spread of NDV. (a) NP distribution of each virus in the absence of 2% agar overlay. BSR-T7/5 cells were infected with each virus at an MOI of 0.01. After 1 h of adsorption, the inoculum was removed and replaced with an overlay medium containing 4% FBS and 2% agar in agar treatment group. Cells were left at room temperature for 30 min until the agar solidified and plates were then put in the incubator for the specified time. The overlay was then picked out and cells were analysed by IFA at 36 hpi. NP protein was detected with anti-NP antibody (Green) and DAPI was used to stain nuclei. (b) Fluorescent areas in (a) were measured using Image J software. The fluorescent area of rSG10 was defined as 1. The relative fluorescent area of rSG10-K1756A and rSG10-G1780A were compared with that of rSG10. (c) BSR-T7/5 cells were infected with each virus at an MOI of 0.001 in 6-well plates. After adsorption for 1 h, the inoculum was removed and replaced with an overlay medium containing 4% FBS and 2% agar. After infection for 5 days, the cells were washed with PBS and fixed with 4% formaldehyde for 6 h after picking out the overlay. IFAs were then performed to detect the distribution of NP protein in plaques. (d) Detection of cell-to-cell spread using positive serum. Vero cells were infected with each strain at an MOI of 0.01. After incubation with viruses for 1 h, cells were treated with NDV positive serum with a 1:2 dilution. The DMSO treatment group was prepared as a control. The supernatants of infected Vero cells were collected at the indicated time points. Viral titres were quantified as the TCID50. P values were calculated with a two-way ANOVA; n = 3; *, P < 0.05; **, P < 0.01; ***, P < 0.001. All experiments were performed in triplicate.
Figure 6. NP protein located in TNTs. Vero cells were infected by rSG10 at an MOI of 0.01 for 36 h and cells were analysed by IFA. DAPI was used to stain the nuclei, an anti-NP antibody was used to stain the NP protein of NDV, phalloidin was used to label F-actin and an anti-tubulin antibody was used to stain α/β-tubulin protein.
Figure 7. Effects of methyltransferase motifs on the cell-to-cell spread of NDV via TNTs by western blotting. (a – b) CCK-8 kit assessment of the effect of CytoD and nocodazole on cell viability. The untreated group (control) and DMSO treatment group were prepared as positive controls. A mock group that did not receive the CCK-8 kit reagent was prepared as a negative control. The cell viability of the Control group was defined as 100%. P values were calculated with an ordinary one-way ANOVA; n = 3; ns, not significant. (c) Morphology of Vero and BSR-T7/5 cells treated with 3 μM CytoD. Cells were treated with 3 μM CytoD for 12 h and then analysed by IFA. For the CytoD removed group, after treatment with cytoD for 12 h, the supernatant was removed and cells were washed three times. Then DMEM with 2% FBS was added and cells incubated for 3 h. (d) Differences in viral protein levels after infection at 1 MOI and CytoD treatment were detected by western blotting. Vero cells were infected by each virus and treated with 3 μM CytoD. At indicated time point, cells were collected and analysed by western blotting. (e) the relative greyscale value of the protein band in (d) was calculated by Image J software. The relative greyscale value of the rSG10 protein band at each time point was defined as 1. The relative greyscale values of the rSG10-K1756A and rSG10-G1780A protein bands were compared with those of the rSG10 protein bands at the corresponding time point in the DMSO/CytoD group. In the DMSO-treated group, P values are labelled by black *. In the CytoD-treated group, P values are labelled blue *. P values were calculated with a two -way ANOVA; n = 3; **, P < 0.01; ***, P < 0.001; ****, P < 0.0001. (f) Differences in the levels of viral proteins after infection and CytoD treatment were detected by western blotting. Vero cells were infected by each virus at 0.01 MOI and treated with 3 μM cytoD. At indicated time points, cells were collected and analysed by western blotting. (g) the relative greyscale value of the protein band in (f). P values were calculated with a two -way ANOVA; n = 3; *, P < 0.05; **, P < 0.01. (h) Differences in the levels of viral proteins after treatment with nocodazole were detected by western blotting. Vero cells were infected by each virus and treated with 15 mM nocodazole. At 48 hpi, cells were collected and analysed by western blotting. (i) the relative greyscale value of the protein band in (h). P values were calculated with a two-way ANOVA; n = 3; ***, P < 0.001. All experiments were carried out in triplicate.
Figure 8. Effect of methyltransferase motifs on the cell-to-cell spread of NDV via TNTs by IFA. (a) IFA analysis of protein distribution after CytoD treatment. Vero cells were infected by each virus and treated with CytoD for 36 h. Afterwards, cells were fixed and analysed by IFA. Anti-NP antibodies were used to detect NP protein and DAPI was used to stain nuclei. (b) the fluorescent area was analysed by Image J software. The fluorescent area of the DMSO group was defined as 100%. Minus numbers indicate decreased fluorescent area percentage in the CytoD group compared with the DMSO group. P values were calculated with a two-way ANOVA; n = 3; ****, P < 0.0001. (c) the fluorescent area of rSG10 was defined as 100%. P values were calculated with a two-way ANOVA; n = 3; ***, P < 0.001; ****, P < 0.0001. (d) Analysis of protein distribution after nocodazole treatment. Vero cells were infected by each virus and treated with nocodazole for 36 h. Afterwards, cells were fixed and analysed by IFA. Anti-NP antibodies were used to detect NP protein and DAPI was used to stain nuclei. All experiments were performed in triplicate.
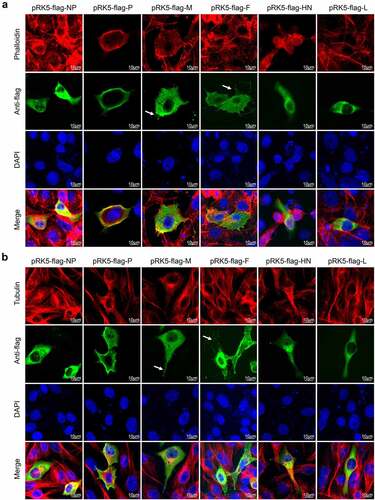
Figure 9. NDV M and F proteins induce formation of cellular extensions.(a) Vero cells were transfected with pRK5-flag-NP, pRK5-flag-P, pRK5-flag-M, pRK5-flag-F, pRK5-flag-HN or pRK5-flag-L. At 36 hpt, cells were processed for IFA. Viral proteins were detected with anti-flag antibodies, F-actin was detected using phalloidin and DAPI was used to stain nuclei. (b) Vero cells were transfected with pRK5-flag-NP, pRK5-flag-P, pRK5-flag-M, pRK5-flag-F, pRK5-flag-HN or pRK5-flag-L. At 36 hpt, cells were processed for IFA. Viral proteins were detected with anti-flag antibodies, tubulin was detected with anti-α/β-tubulin antibodies and DAPI was used to stain nuclei.
Data availability statement
The data that support the findings of this study are available from the corresponding author upon reasonable request ([email protected]).