
Figures & data
Table 1. The baseline characteristics between the immunoprophylaxis failure and success group.
Table 2. The average nucleotide mutation rates in the HBsAg-related regions between the immunoprophylaxis failure and success group.
Figure 1. The schematic representation showing the structure of SPI sequence. (a) a schematic diagram showing the structure of SPI. (b) Alignment of SPI nucleotide sequences, including the consensus sequences from Genbank database and the sequences of the mutant HBV strains. (c) the representative peak diagrams of the mutant HBV strains.
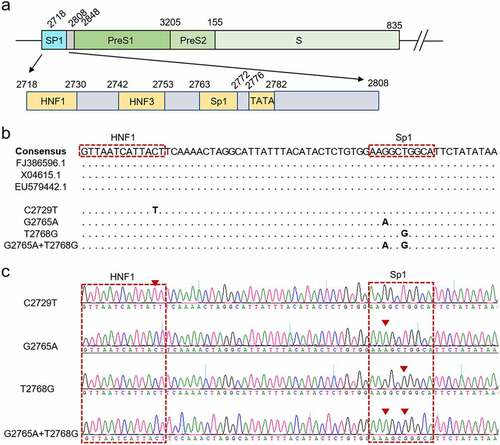
Figure 2. The C2729T mutation promotes HBsAg secretion by reducing LHBs expression. The pBB4.5–HBV 1.2×-WT or pBB4.5–HBV 1.2×-C2729T plasmid and pCDH-Nluc plasmid were co-transfected into HepG2 and Huh7 cells. Cell culture supernatants and cells were harvested at 3 days post-transfection. The levels of (a) HBsAg and (b) HBeAg in the cell culture supernatants were detected by chemiluminescence immunoassays. (c) the levels of intracellular LHBs and SHBs were detected by Western Blot. The β-actin protein was used as the internal control. The levels of LHBs were normalized to (d) the levels of β-actin or (e) the levels of SHBs using ImageJ software. (f) the pBB4.5–HBV 1.2×-WT plasmid, pCDH-LHBs or pCDH vector control plasmid, and pCDH-Nluc plasmid were co-transfected into HepG2 and Huh7 cells, the levels of HBsAg in the cell culture supernatants were detected by chemiluminescence immunoassays, and the levels of intracellular LHBs were detected by Western Blot at 3 days post-transfection. The data were presented as the mean ± SD of three independent experiments and were analysed by Student’s t-test. ns-no statistical significance, ***p < 0.001, ****p < 0.0001.
Figure 3. The C2729T mutation suppresses HBV production. The pBB4.5-HBV1.2×-WT or pBB4.5-HBV1.2×-C2729T plasmid and pCDH-Nluc plasmid were co-transfected into HepG2 and Huh7 cells. The cells and cell culture supernatants were harvested at 3 and 5 days post-transfection to detect the levels of HBV RNA and DNA, respectively. The levels of intracellular total HBV RNA (a) and 3.5 kb HBV RNA (b) were detected by RT-qPCR. The ACTB mRNA was used as the internal control. (c) the levels of intracellular HBV mRNAs including 3.5 kb and 2.4/2.1 kb HBV RNAs were detected by Northern Blot. The 28S and 18S rRNAs were used as the internal control. The levels of (d) 3.5 kb and (e) 2.4/2.1 kb HBV RNAs were normalized to the levels 18S RNA using ImageJ software. (f) the levels of HBV DNA in the cell culture supernatants were detected by qPCR. The data were presented as the mean ± SD of three independent experiments and were analysed by Student’s t-test. ns-no statistical significance, **p < 0.01, ***p < 0.001, ****p < 0.0001.
Figure 4. LHBs can rescue the reduced HBV production mediated by the C2729T mutation. The pBB4.5-HBV1.2×-WT or pBB4.5-HBV1.2×-C2729T plasmid, pCDH-LHBs or pCDH vector control plasmid, and pCDH-Nluc plasmid were co-transfected into HepG2 and Huh7 cells. Cell culture supernatants and cells were harvested at 3 and 5 days post-transfection to detect the levels of HBsAg and HBV DNA, respectively. (a & b) the levels of HBsAg in the cell culture supernatants were detected by chemiluminescence immunoassays, and the levels of intracellular LHBs were detected by Western Blot in HepG2 and Huh7 cells. The β-actin protein was used as the internal control. (c & d) the levels of supernatant HBV DNA were detected by qPCR in HepG2 and Huh7 cells. The data were presented as the mean ± SD of three independent experiments and were analysed by Student’s t-test. ns- no statistical significance, *p < 0.05, **p < 0.01, ***p < 0.001, ****p < 0.0001.
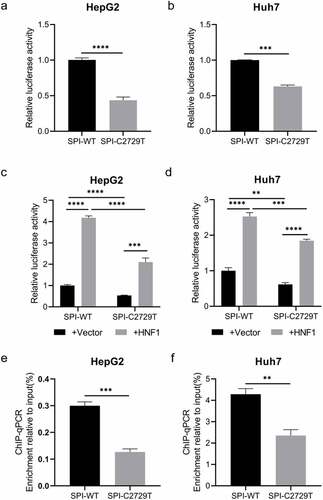
Figure 5. The effect of the C2729T mutation on the transcriptional activity of SPI. The transcriptional activities of SPI were detected by dual-luciferase reporter assays at 48 h after (a & b) co-transfection of pGL3-SPI or pGL3-SPI-C2729T plasmid and pRL-TK plasmid or (c & d) co-transfection of pGL3-SPI or pGL3-SPI-C2729T plasmid, pcDNA3.1-HNF1-HA or pcDNA3.1 vector control plasmid, and pRL-TK plasmid in HepG2 and Huh7 cells. (e & f) the binding activities between HNF1 and HBV SPI were detected by ChIP-qPCR at 48 h after co-transfection of pBB4.5-HBV1.2×-WT or pBB4.5-HBV1.2×-C2729T plasmid and pCDNA3.1-HNF1-HA in HepG2 and Huh7 cells. The data were presented as the mean ± SD of three independent experiments and were analysed by Student’s t-test. **p < 0.01, ***p < 0.001, ****p < 0.0001.
Supplemental Material
Download MS Word (487.5 KB)Data availability statement
The authors confirm that the data reported in this study are available within the article and/or its supplementary materials.