Figures & data
Figure 1. P-Rex1 Rac-GEF activity is inhibited by small molecules PREX-in1 and compound 10. (a) Full-length recombinant EE-P-Rex1 (50 nM final concentration, filled symbols), or control samples without P-Rex1 (open symbols), were incubated with the indicated concentrations of PREX-in1 (left-hand panels) or compound 10 (right-hand panels) for 30 min, before Rac-GEF activity was measured by liposome-based GEF assay in the presence of liposomes that contained 10 µM PIP3 to activate P-Rex1, using prenylated GDP-loaded EE-Rac2 as substrate (100 nM final). Rac2 activity (GTP-loading) is expressed as % of maximal GTP loading in the EDTA positive control. Inserts: inhibition of P-Rex1 is plotted using Rac-GEF activity without compound as 0% and Rac2 GTP-loading without P-Rex1 as 100%. Data are mean ± SEM of duplicate measurements from 3 independent experiments for each compound. Statistics are two-way ANOVA in main panels and one-way ANOVA in inserts, both with Dunnett’s multiple comparisons test. (b) The Rac-GEF activity of full-length recombinant EE-P-Rex1 was measured as in (a) after incubating samples with or without P-Rex1 in the presence of 10 µM PREX-in1 or 10 µM compound 10 (closed symbols), or after mock-treatment (open symbols), by liposome-based GEF assay with liposomes containing PIP3, and comparing prenylated EE-Rac1 and EE-Rac2 as substrates, as indicated. Rac GTP-loading is expressed as % of the EDTA positive control. Data are mean ± SEM of duplicate measurements from 3–5 independent experiments for each compound and Rac GTPase; each dot is the mean of one experiment. Statistics are two-way ANOVA with Sidak’s multiple comparisons test.
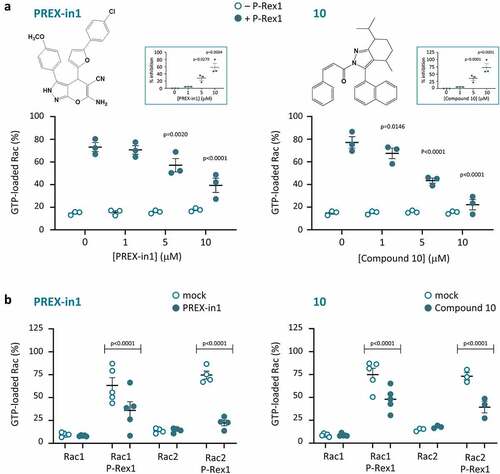
Figure 2. PREX-in1 inhibits P-Rex1 and P-Rex2 through the catalytic DH domain. (a) Schematic showing the domain structures of full-length (FL) P-Rex1 and P-Rex2 and the isolated P-Rex1 DHPH and DH domain and P-Rex2 DH domain proteins. (b) Upper panel: Full-length recombinant EE-P-Rex1 (50 nM) or P-Rex2 (40 nM), or the isolated DH domains (200 nM) or DHPH domains (100 nM), were incubated with 10 M PREX-in1 for 30 min (filled symbols), or were mock-treated (open symbols). Their Rac-GEF activity was then measured by liposome-based GEF assay using 100 nM prenylated Rac1 as substrate, in the presence of liposomes with 10 µM PIP3 for the full-length GEF protein, or without PIP3 for the isolated domains. Rac-GEF activity is plotted as Rac GTP-loading in the presence of GEF, expressed as % of maximal Rac GTP-loading in the EDTA positive control. Lower panel: inhibition of P-Rex is plotted using Rac-GEF activity without PREX-in1 as 0% and basal Rac1 GTP-loading without P-Rex as 100%. Data are mean ± SEM of 4–6 independent experiments for each P-Rex protein; each dot is the mean of one experiment. Statistics are two-way ANOVA for the main panel and one-way ANOVA for the insert, both with Sidak’s multiple comparisons test.
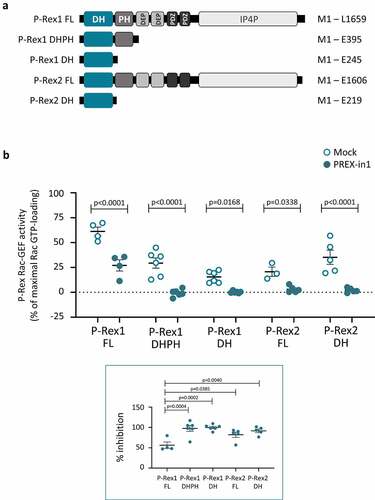
Figure 3. PREX-in1 (but not EHop-016) inhibits the P-Rex1 DHPH domain in a second type of GEF assay. (a, b) Recombinant EE-P-Rex1 DHPH domains (100 nM, filled symbols), or control samples without P-Rex1 (open symbols) were incubated with 10 µM PREX-in1 (a) or EHop-016 (b) for 30 min (green symbols), or were mock-treated (grey symbols), before their Rac-GEF activity was measured in real time by mant-GTP GEF assay using 150 nM EE-Rac1 produced in bacteria as substrate. Rac1 activity (GTP-loading) is expressed as mant fluorescence. (c) Quantification of P-Rex1 DHPH Rac-GEF activity from experiments such as those shown in (a, b) under the indicated conditions (inhibitor concentrations are in µM), expressed as area under the curve (AUC) integrated over 32 min. Data are mean ± SEM of 4 independent experiments. Statistics are one-way ANOVA with Sidak’s multiple comparisons test. (d) Dose response of PREX-in1 dependent inhibition of P-Rex1 DHPH Rac-GEF activity in the mant-GTP assay as in (a,b), using the indicated concentrations of PREX-in1, quantified by integration of the AUC as in (c). Data are mean ± SEM of 2–4 independent experiments. Statistics are mixed-effects one-way ANOVA with Holm-Sidak’s multiple comparisons test.
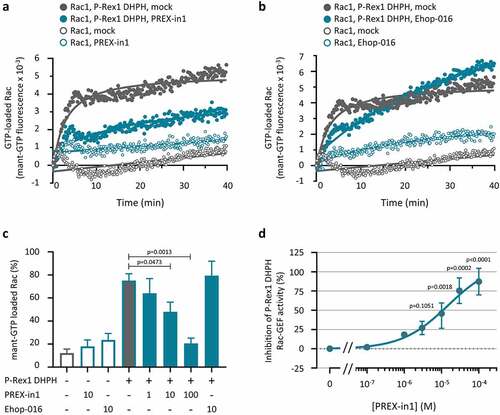
Figure 4. PREX-in1 inhibits P-Rex Rac-GEFs but not a selection of other Rho-GEFs. (a) Schematic of the domain structure of the Rho-GEFs tested, with domains used in GEF activity assays highlighted. (b) Upper panel: Recombinant Rho-GEFs or catalytic domains (100 nM P-Rex1 DHPH, 50 nM full-length Tiam1, 100 nM ITSN1 DHPH, 765 nM DOCK10 DHR2, or 500 nM ECT2 DHPH) were incubated with 10 µM PREX-in1 for 30 min (filled symbols), or were mock-treated (open symbols). Their GEF activity was then measured by liposome-based GEF assay using their respective Sf9-cell derived prenylated target Rho-GTPase (200 nM) as substrate. Rho-GTPase activity is expressed as % of maximal GTP loading in their respective EDTA positive controls. Lower panel: inhibition of Rho-GEFs by PREX-in1 is plotted using GEF activity without PREX-in1 as 0%, and basal GTP-loading of the target Rho-GTPase (without GEF) as 100%. Data are mean ± SEM of 4–5 independent experiments for each Rho-GEF protein; each dot is the mean of one experiment. Statistics are two-way (upper panel) and one-way (lower panel) ANOVA, both with Sidak’s multiple comparisons test.
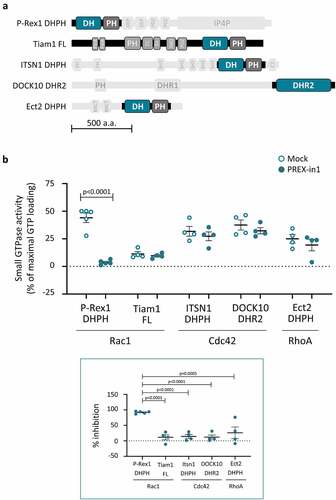
Figure 5. Structure activity relationship of PREX-in1 and its derivatives. (a) Chemical structure of PREX-in1, nominally divided into four regions, containing the (a) chlorophenyl, (b) furan, (c) 6-amino-2,4-dihydropyrano[2,3-c]pyrazole-5-carbonitrile and (d) methoxy-benzene groups. (b) Dose response of the inhibition of recombinant EE-P-Rex1 DHPH domains by PREX-in1 in the liposome-based GEF assay with 200 nM prenylated EE-Rac2 as substrate. Inhibition of P-Rex DHPH is plotted using Rac-GEF activity without PREX-in1 as 0%, and Rac GTP-loading of Rac without P-Rex1 DHPH as 100%. Data are mean ± SEM of 5 independent experiments. The IC50 was determined by application of a non-linear fit curve. (c) Structure activity relationship tests measuring the effect of PREX-in1 derivatives on P-Rex1 Rac-GEF activity. Compounds (10 µM) were incubated for 30 min with 200 nM iDH EE-P-Rex1 DH domain (compounds 11–29) or with 100 nM EE-P-Rex1 DHPH domains (PREX-in1, compounds 2–10 and 30–128) before being tested in the liposome-based GEF activity assay with 200 nM prenylated EE-Rac1 as substrate. Rac-GEF activity is plotted with the activity in the absence of compound set to 100% and basal Rac1 GTP-loading (without P-Rex1) set to 0%. Data are mean ± SEM from ≥ 3 independent experiments; dark grey dots denote compounds that inhibit P-Rex1 > 50%, and dark green dots are compounds that inhibit >90%. Structures of representative compounds are shown. (d, e) Dose responses of the inhibition of recombinant EE-P-Rex1 DHPH domains by compound 16 (d) or compound 116 (e) were assayed as in (b). Data in (d) are mean ± range of 2 experiments representative of 4 performed under similar conditions. Data in (e) are mean ± SEM of 3 independent experiments. The IC50s were determined by application of a non-linear fit curve.
![Figure 5. Structure activity relationship of PREX-in1 and its derivatives. (a) Chemical structure of PREX-in1, nominally divided into four regions, containing the (a) chlorophenyl, (b) furan, (c) 6-amino-2,4-dihydropyrano[2,3-c]pyrazole-5-carbonitrile and (d) methoxy-benzene groups. (b) Dose response of the inhibition of recombinant EE-P-Rex1 DHPH domains by PREX-in1 in the liposome-based GEF assay with 200 nM prenylated EE-Rac2 as substrate. Inhibition of P-Rex DHPH is plotted using Rac-GEF activity without PREX-in1 as 0%, and Rac GTP-loading of Rac without P-Rex1 DHPH as 100%. Data are mean ± SEM of 5 independent experiments. The IC50 was determined by application of a non-linear fit curve. (c) Structure activity relationship tests measuring the effect of PREX-in1 derivatives on P-Rex1 Rac-GEF activity. Compounds (10 µM) were incubated for 30 min with 200 nM iDH EE-P-Rex1 DH domain (compounds 11–29) or with 100 nM EE-P-Rex1 DHPH domains (PREX-in1, compounds 2–10 and 30–128) before being tested in the liposome-based GEF activity assay with 200 nM prenylated EE-Rac1 as substrate. Rac-GEF activity is plotted with the activity in the absence of compound set to 100% and basal Rac1 GTP-loading (without P-Rex1) set to 0%. Data are mean ± SEM from ≥ 3 independent experiments; dark grey dots denote compounds that inhibit P-Rex1 > 50%, and dark green dots are compounds that inhibit >90%. Structures of representative compounds are shown. (d, e) Dose responses of the inhibition of recombinant EE-P-Rex1 DHPH domains by compound 16 (d) or compound 116 (e) were assayed as in (b). Data in (d) are mean ± range of 2 experiments representative of 4 performed under similar conditions. Data in (e) are mean ± SEM of 3 independent experiments. The IC50s were determined by application of a non-linear fit curve.](/cms/asset/50a94f33-80c5-412e-8c7b-93c587f5782f/ksgt_a_2131313_f0005_oc.jpg)
Figure 6. PREX-in1 affects the cell cycle in a similar manner to NSC23766. (a) Representative flow cytometry histogram showing cell-cycle stages of propidium iodide stained HEK293 cells after mock-treatment with vehicle (DMSO) for 24 h. (b) Quantification of cell-cycle stages of HEK293 cells determined as in (a), after 24 h treatment with increasing concentrations of PREX-in1, as indicated, or with 10 µM NSC23766. Data are mean % ± SEM of 5 experiments performed in triplicate. Statistics are two-way ANOVA with Dunnett’s multiple comparisons tests, comparing each cell-cycle stage to the mock-treated condition.
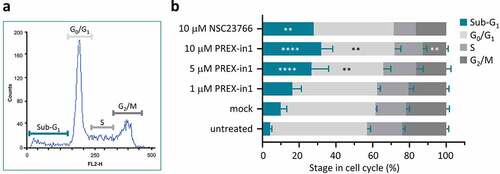
Figure 7. PREX-in1 inhibits the P-Rex1-dependent spreading of endothelial cells upon stimulation with PDGF. PAE cells were transfected with eGFP-P-Rex1, or mock-transfected, serum-starved, and then treated with 1 µM PREX-in1 for 15 min (filled symbols), or mock-treated (open symbols), followed by stimulation with 10 ng/ml PDGF for 10 min, or mock-stimulation, as indicated. Cells were fixed, permeabilised and stained with TRITC-phalloidin. Images were acquired by wide-field fluorescence microscopy and analysed blinded to experimental design for both manual and automated ImageJ analysis. (a) Representative fluorescence micrographs of the F-actin structure (phalloidin stain) of PAE cells expressing eGFP-P-Rex1 (right) or not (left and middle), and stimulated with PDGF (middle and right) or not (left). (b) Quantification. Cell morphologies (top left panel) were categorized manually according to the presence of lamellipodia, membrane ruffles and spread phenotype. Circularity (top right) and cell surface area (bottom left) were quantified using automated ImageJ analysis. The proportion of spread cells (bottom right) was defined as cells with a minimum surface area of 1869 m2, >50% larger than the mean under basal conditions (1246 μm2). Data are mean ± SEM from 3 independent experiments. At least 78 cells were analysed per condition for each experiment. Statistics are three-way ANOVA with Sidak’s multiple comparisons test.
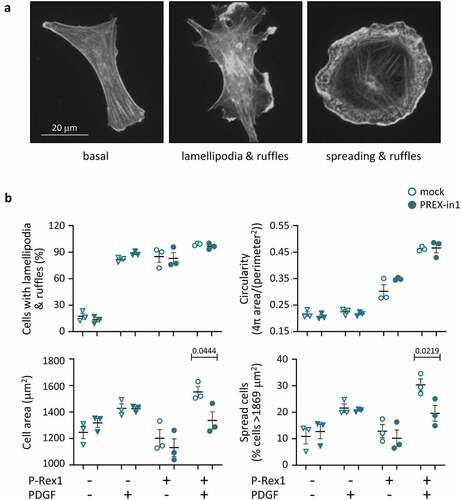
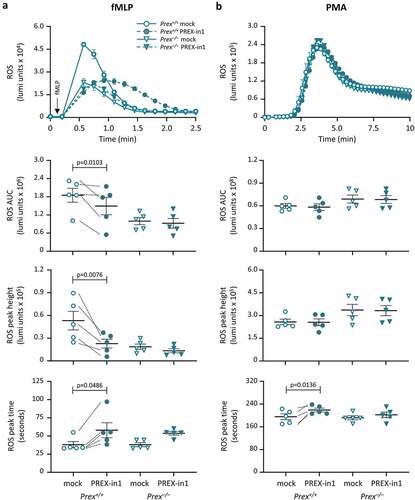
Figure 8. PREX-in1 inhibits the P-Rex1 dependent production of ROS in mouse neutrophils stimulated with the chemoattractant fMLP. Purified neutrophils from wild type (Prex+/+, circles) or P-Rex deficient (Prex–/–, triangles) mice were treated with 1 µM PREX-in1 for 7 min (filled symbols), or were mock-treated (open symbols), prior to stimulation with 10 µM fMLP (a) or 500 nM PMA (b). Real-time ROS production was measured using a luminometer. Top panels show representative curves. The amount of ROS produced (area under the curve, AUC) in 2 min (a) or 10 min (b), respectively, and the height and timing of the peak of ROS production were quantified. Data are mean ± SEM of 5 experiments; each dot is the mean of one experiment. fMLP and PMA responses were tested using neutrophils from the same mice. Statistics are two-way ANOVA with Sidak’s multiple comparisons test.