Figures & data
Figure 1. Wild-type Cdc42 and Cdc42(G12V) promote A375 melanoma cell proliferation in vitro. Cell proliferation assays were performed using untransfected A375 cells, and cell stably transfected with empty vector (VO), Cdc42 WT, or Cdc42(G12V). The percentage cell proliferation relative to the initial cells plated were quantified at 0 1,3,5, and 8 days using the MTT assay and analyzed using GraphPad prism. Significant differences compared with the parent A375 cells (***p<0.001) were determined by the Student’s t-test.
Figure 2. A PI3K inhibitor (LY294002) attenuates the levels of p-Akt in the A375 melanoma line, including cells expressing Cdc42(G12V). A375 cells or A375 cells stably expressing VO, Cdc42 WT or Cdc42(G12V) were treated with either DMSO (vehicle) or LY294002 (25 µM) for 24 h. Cells were analyzed by western blot for the differences in Akt, pAkt, and total Cdc42 expression in untreated and LY294002 treated cells. The blots show the levels of pAkt, Akt, and total Cdc42. Beta-actin was used as the loading control.
Figure 3. Cdc42(g12v) promotes the proliferation of A375 cells, which is attenuated with a PI3K inhibitor. Cell proliferation assays were performed using untransfected A375 cells and cells stably transfected with empty vector (VO), Cdc42 WT, or Cdc42(G12V). The cells were treated daily with either vehicle or a PI3K inhibitor LY294002 at concentrations of 0–10 µM. After 2 days, the percentage proliferation was analyzed using GraphPad prism. Significant differences compared with the parent A375 cells (###p<0.001) and compared with the different concentrations of LY294002 (***p<0.001) were determined by the Student’s t-test.
Figure 4. Cdc42 G12V enhances anchorage independent growth of A375 cells, and this growth is attenuated with inhibition of PI3K. A375 cells stably expressing VO, Cdc42 WT, and Cdc42(G12V) were plated in soft agar and treated weekly as described in the methods for 21 days. The number of colonies formed were counted using Image j, and the results are expressed as the means (± SEM, n = 4). Significance (***p< 0.001) was determined by the Student’s t-test.

Figure 5. Cdc42 G12V promotes migration of A375 melanoma cells, and this migration is attenuated by inhibition of PI3K. a) Representative bright field images of confluent monolayers of A375, and A375 cells stably expressing VO, Cdc42 WT and Cdc42(G12V) treated with either vehicle control or PI3K inhibitor (LY294002, 25 µM) are shown. The blue lines indicate the demarcation of the original scratch wound. b) the distance of cell migration and the number of cells that migrated into the wound area are expressed as the mean (n=3) relative to the controls. The error bars represent the standard error of the mean. Significance (*p < 0.05, **p < 0.01, ***p < 0.001) was determined by the Student’s t-test.
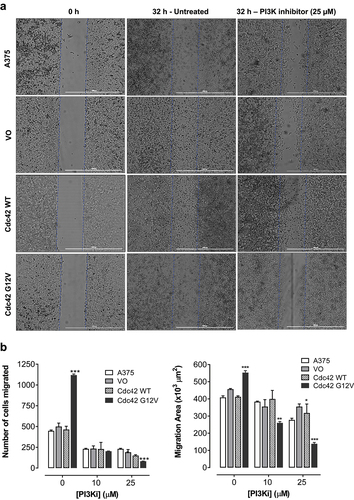
Figure 6. Cdc42(g12v) enhances the invasiveness of A375 cells, and this invasion is attenuated by inhibition of PI3K. A. A375 cells or A375 cells stably expressing VO, Cdc42 WT, or Cdc42(G12V) were treated with either DMSO (vehicle) or LY294002 (25 µM). a) Representative bright field images are shown. b) the number of invading cells were quantified using Image j. Values represent the mean ± SD of three independent experiments performed in triplicate. Significance (*p < 0.05; **p < 0.01; ***p < 0.001) compared with control group was determined by the Student’s t-test.