
Figures & data
Figure 1. Synthesis of zinc oxide nanoparticles via isolated bacterial strain.
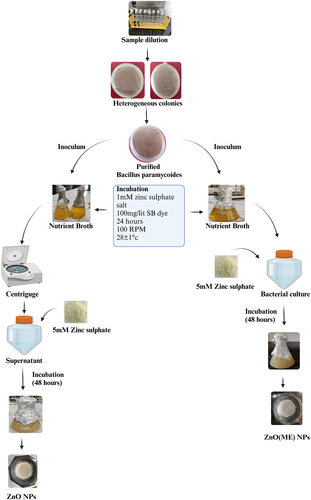
Figure 2. Phylogenetic tree of isolated bacillus paramycoides.
Figure 3. Characterization of ZnO and ZnO-ME. (a) FT-IR of ZnO and ZnO-ME (before dye adsorption), (b) XRD of ZnO and ZnO-ME and (c) UV–VIS spectrum of ZnO and ZnO-ME.
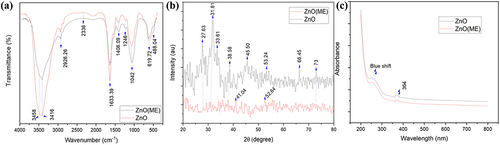
Figure 4. (a,b) surface morphology analysis, (c,d) EDX spectrum and (e,f) nitrogen adsorption–desorption curve and pore size distribution for ZnO-ME and ZnO.
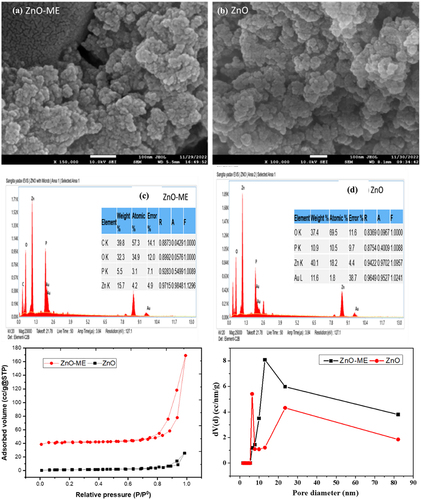
Figure 5. Predicted against actual values plots for (a) for ZnO and (b) for ZnO-ME and normal percentage probability plots for (c) for ZnO and (d) for ZnO-ME for sulfur black dye adsorption.
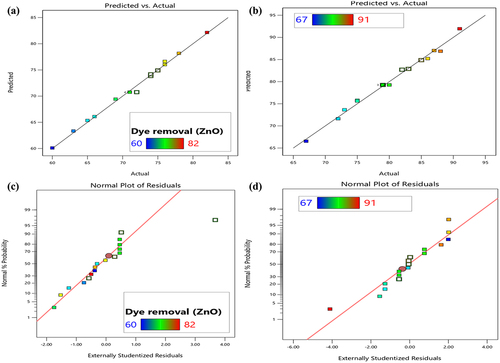
Table 1. Analysis of variance (ANOVA) for the adsorption of sulfur black dye using ZnO and ZnO-ME nanoparticles
Table 2. Model summary and statistical analysis.
Figure 6. Residual plots for PBD for ZnO and ZnO-ME nanoparticles.
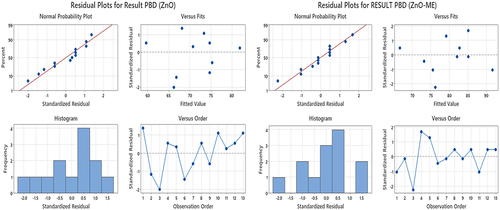
Figure 7. Residual plots for FFD for ZnO and ZnO-ME nanoparticles.
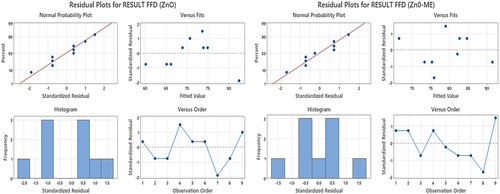
Table 3. Comparison of adsorption percentage of zinc oxide nanoparticles for various dyes.
Table 4. Isotherm parameters for sulfur black dye adsorption on ZnO and ZnO-ME.
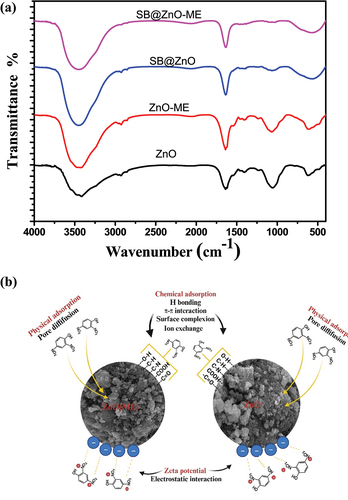
Figure 8. (a) FT-IR spectra of nanomaterials before and after adsorption; (b) potential adsorption mechanism.
Supplementary Information-clean.docx
Download MS Word (1.6 MB)Data availability statement
The authors confirm that the data supporting the findings of this study are available within the article and its supplementary materials.