
Figures & data
Figure 1 Study Pipeline. a Animal models used: FUS model - ΔFUS(1-359) mice on a congenic C57Bl/6 background, TDP model - TDP-43A315T mice on a congenic C57Bl/6 background, Hq model - Harlequin (Hq) mutant mice (B6CBACa Aw-J/A-Aifm1Hq/J), and Aifm1 model - Aifm1 (R200 del) KI mice. b Schematic diagram representing the methodological design of this study.
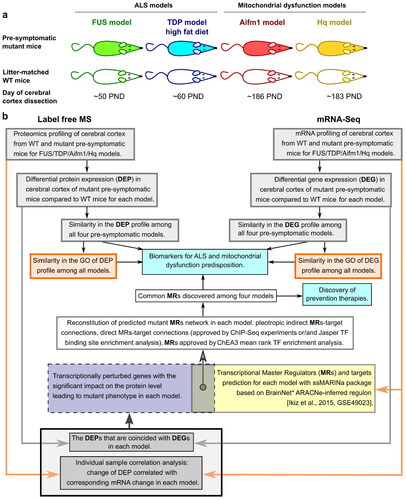
Figure 2 Comparison of mutant and wildtype (WT) mice cerebral cortex mRNA and protein expression profiles. a Volcano plots illustrate differentially expressed proteins (DEPs) and differentially expressed genes (DEGs) in FUS WT (n = 5) versus FUS mutant (mut) (n = 7), TDP WT (n = 5) versus TDP mut (n = 6), Aifm1 WT (n = 4) versus Aifm1 mut (n = 4), and Hq WT (n = 4) versus Hq mut (n = 4) samples. Horizontal dashed lines are drawn at p-value = 0.05, and blue dots indicate p-value ≤ 0.05. Proteins and mRNAs indicated by purple dots have FDR adjusted p-value ≤ 0.1. DEPs and DEGs are labeled with corresponding gene names. b Commonly enriched Gene Ontology (GO) Biological Process (BP) terms in DEPs across the four mice models. Yellow boxes represent overlapping Biological Process GO terms (BP).
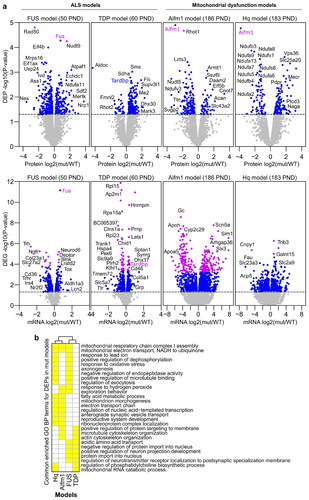
Figure 3 Protein overexpression shared across ALS/FTD and AIF-deficient mitochondrial disease models. a Protein overexpression observed in at least two models with a p-value ≤ 0.05. Proteins are grouped and color coded according to their annotated function. b Metabolic pathways utilized by commonly overexpressed metabolic enzymes (coloured red), adapted from the KEGG PATHWAY database (Citation94).
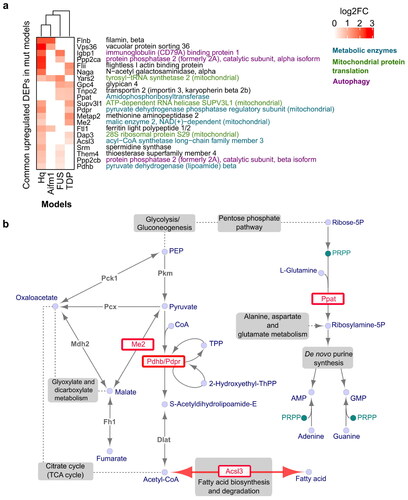
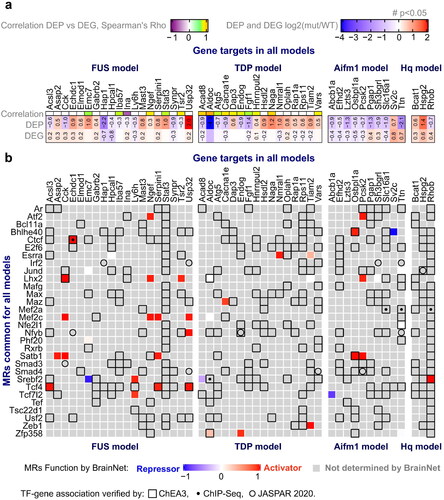
Figure 4 Common master regulators (MRs) among all models. a Proteins/gene targets of interest were selected if significant Spearman correlation (Rho) was identified between protein and mRNA expression across WT and mutant samples, or they exhibited significant differential expression at both the protein and gene level (p-value <0.05 as indicated by a number (#)) (see Materials and methods). b Common MRs found by ssMARINa (Citation39–42) with reference BrainNet (Citation41,Citation42) regulon across the four disease models are shown in the rows, with the genes of interest for each model in the columns. MR – target gene associations verified by ChEA3 (Citation46), ChIP-Seq, or JASPAR (Citation43) are indicated by an empty square, dot or empty circle respectively. The effect of MRs on the genes of interest (repressor, activator) for each model are indicated (blue, red respectively). MRs without a reported function on a gene are denoted in grey.
Supplemental Material
Download Zip (6.2 MB)Data availability statement
The datasets supporting the conclusions of this article are available in the Gene Expression Omnibus (GEO) repository [GSE196482, https://www.ncbi.nlm.nih.gov/geo/query/acc.cgi?acc=GSE196482] and on the ProteomeXchange Consortium via the PRIDE partner repository [PXD030210, http://proteomecentral.proteomexchange.org/cgi/GetDataset?ID=PXD030210].