
Figures & data
Figure 1. (a). Byttneriea herbacea plant, (b). (i) Plant extract of Byttneriea herbacea (ii). Green synthesized BH-AgNPs by leaf extract of Byttneriea herbacea (c). UV-Visible absorption spectra of BH-AgNPs synthesized from Byttneriea herbacea leaf extract with 0.02 M silver nitrate.
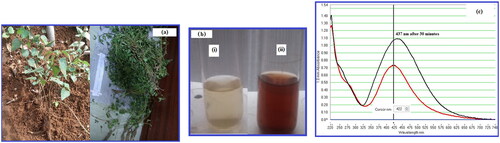
Figure 2. (a). FTIR absorption spectra of Byttneriea herbacea leaf extract and Fig. 2. (b). BH-AgNPs synthesized from Byttneriea herbacea leaf extract with 0.02 M silver nitrate.
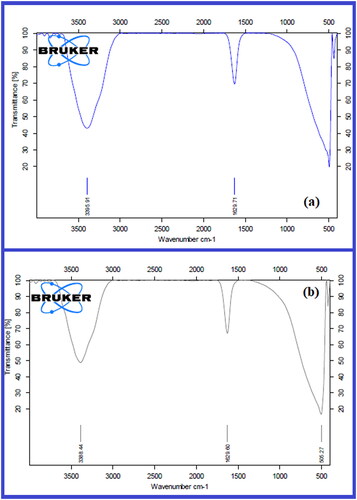
Figure 3. (a). Particle size analysis of BH-AgNPs biosynthesized with leaf extract of Byttneriea herbacea Fig.3. (b). Zeta Potential analysis of BH-AgNPs biosynthesized with leaf extract of Byttneriea herbacea.
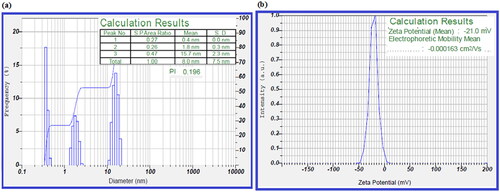
Figure 4. a. TEM images of biosynthesized BH-AgNPs at different magnification (a) 100 Kx (b)50 Kx (c) 20Kx (d) 10Kx (e)10 Kx and (f) SAED pattern showed four diffraction rings Fig. 4. b. EDX analysis of biosynthesized BH-AgNPs.
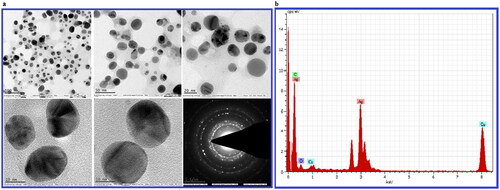
Figure 5. a. Antibacterial activity of biosynthesized BH- AgNPs on Gram negative antibiotic resistant E.coli strains E.coli Mutant strain, E.coli Donor strain, E.coli recipient strain, and gram positive Staphylococcus aureus and Bacillus megaterium at different concentrations of 10mcg, 20 mcg, 30mcg and 40mcg and centre Ab- Antibiotic (Amoxyclav 30mcg, Himedia-SD063) Fig 5.b. Graphical representation of Antibacterial activity of green synthesized BH- AgNPs on Gram negative antibiotic resistant E.coli strains E.coli Mutant strain, E.coli Donor strain, E.coli recipient strain, and gram positive Staphylococcus aureus and Bacillus megaterium and antibiotic Amoxycillin 30 mcg Himedia-SD063 Fig 5.c. Antioxidant activity of biosynthesized BH- AgNPs by DPPH method µg/mL.
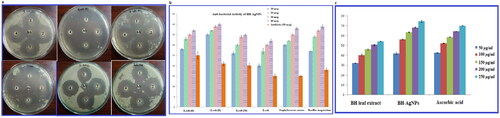
Table 1. Antimicrobial Activity of BH-AgNPs.
Table: 2. DPPH antioxidant activity of biosynthesized BH-AgNPs.
Figure 6. a. MTT assay of cytotoxic studies of green synthesized BH-AgNPs on KB –Human oral carcinoma cell line and its Morphological changes of KB cells observed under an inverted light microscope. a. Untreated KB cell line b. KB cell line cells treated with 25 µg of BH-AgNPs c. KB- cell line treated with 50 µg of BH-AgNPs d. KB cell lines treated with 100 µg of BH-AgNPs e. KB cell lines treated with 200µg of BH-AgNPs and f. Standard control (Camptothecin 7.5 µM). Fig.6.b and c. Comparative percentage of Cell viability studies of green synthesized BH-AgNPs on KB –Human oral carcinoma cell line by MTT assay and the IC50 VALUE is calculated to be = 89.25µL/mL.
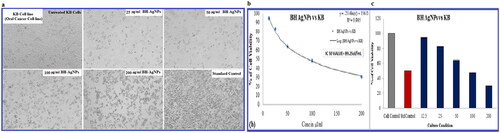
Figure 7. a.b.c. Cycle cell assay of green synthesized BH-AgNPs on KB –Human oral carcinoma cell line (a): Flow cytometric histograms showing the phases of cell cycle distribution in the KB cell line treated with BH AgNPs with IC50 values and standard drug camptothecin at IC50 value compared to the control. (b) Table showing the % of Cells gets arrested in the different stages of their life cycle. (c) Overlay showing the % of cells gets arrested in the different stages of their life cycle.
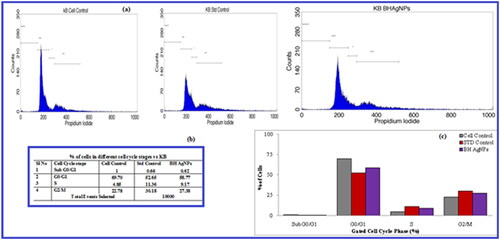
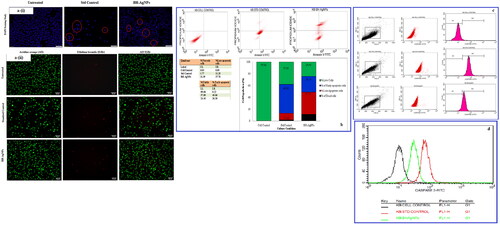
Figure 8. a(i). Effect of green synthesized BH-AgNPs on nuclear damages in KB oral cancer cells were observed with Hoechst 33258 staining under fluorescence microscopy. (A) Control (untreated), (B) Standard Control (7.5 µg/mL) and (C) BH-AgNPs (89.25 µg/mL) for 24 h. Fig.8. a(ii). Analysis of Dual Fluorescent staining of Acridine orange and Ethidium bromide on KB oral cancer cells of (A) Untreated, (B) Standard Control and (C) BH-AgNPs used to identify apoptosis-associated changes of cell membranes during the process of apoptosis and also to accurately distinguish cells in different stages of apoptosis Fig. 8.b. Apoptotic assay of green synthesized BH-AgNPs on KB –Human oral carcinoma cell line by Flow cytometry assay Figure. 8.c. d. Expression of Apoptotic protein Caspase 3 anlaysis on KB –Human oral carcinoma cell line treated with green synthesized BH-AgNPs.
Data availability statement
All the data related to our research article is present in the manuscript submitted