
Figures & data
Table 1. Experimental groups and concentrations used for PDT to assess the effects of the molecular scaffold on SiHa cells.
Figure 1. Absorption spectra of AlPcS4Cl showing maximum absorption at 672 nm. Included on the upper right side of the graph is a Tauc plot showing the band gap energy of the PS at Eg=1811.
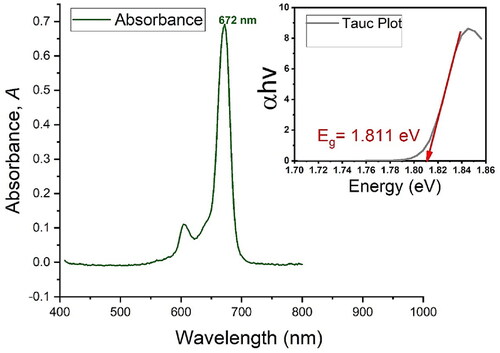
Figure 2. Spectrophotometric analysis and absorption spectra of (A) the PS indicating maximum absorption at 672 nm and the typical minor band at 610 nm. As shown in (B), PEGy-AuNPs indicate an absorption band at 520 nm, and the molecular scaffold (C) indicates absorption bands at 524 nm and 674 nm, which represents the peak of the PS in the molecular scaffold at 674 nm. The mirrored spectra to observe any changes in absorption bands, excitation peaks and wave shifts is shown in (D), where plots a and b are plotted using the primary axis (left) and plot c is plotted against the secondary axis (right) to correct for concentration changes as the aim is to observe the optical properties when mirrored together.
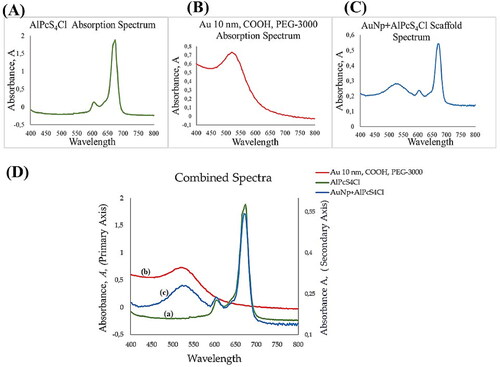
Figure 3. HRTEM images of the molecular scaffold showing well dispersed particles of sizes averaging 10 nm in size and surface alteration in (C) showing the presence of mAbs on the surface of AuNPs.
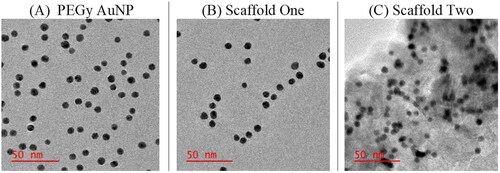
Figure 4. Energy dispersive X-ray spectroscopy analysis (EDX analysis) showing the presence of individual elements on (A) the pure PEGy AuNP, elements including Cu, Au, C, O, (B) the PEGy AuNP-AlPcS4Cl scaffold and (C) the PEGy AuNP-AlPcS4Cl-anti E6 scaffold, elements including Cu,Au, C, O, Al, Cl, S, Ca, C, K, Na, Mg. Elements are observed on the full scale from 0 to 12 keV with peaks of varying intensities.
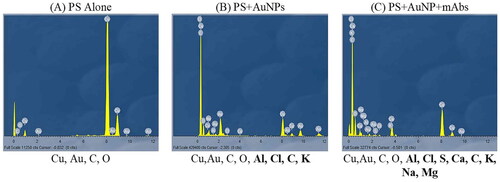
Figure 5. IR spectra showing the transmittance plotted against cycles per reciprocal centimetres. The red circle shows influence of amide (N–H) on the 3500 regions and the green ring shows prominent C–H bonds on the molecular scaffold two, indicating coupling of mAbs to the PEGy-AuNP by covalent linkages.
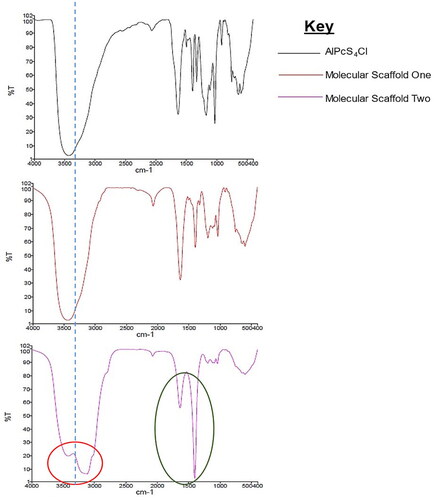
Table 2. A summary of the IR spectra of the PS and molecular scaffolds describing the stretching and bending properties of the compounds.
Figure 6. Fluorescence imaging showing the red autofluorescence of PS bound onto the molecular scaffold. In (a) channel show DAPI stain only (nuclei), in (b) channel shows mitotracker green (mitochondria), in (c) the single channel of red autofluorescence of the PS is seen and in (d) the channels are merged to see all fluorescence as was detected. The merged image demonstrates that the molecular scaffold was successfully internalized by the cells [color online].
![Figure 6. Fluorescence imaging showing the red autofluorescence of PS bound onto the molecular scaffold. In (a) channel show DAPI stain only (nuclei), in (b) channel shows mitotracker green (mitochondria), in (c) the single channel of red autofluorescence of the PS is seen and in (d) the channels are merged to see all fluorescence as was detected. The merged image demonstrates that the molecular scaffold was successfully internalized by the cells [color online].](/cms/asset/0368ce9c-593a-4fbd-acb7-eb5999e44da1/ianb_a_2199037_f0006_c.jpg)
Figure 7. Control groups indicating unaltered morphology after the experimental period, in (a) cells treated with PEGy-AuNP only, (b) cells treated with PS only, (c) cells given mAbs only and, (d) cells that received irradiation only. All control groups showed normal morphology at the end of the experimental period.
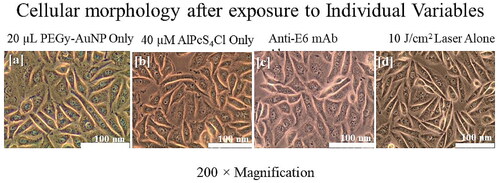
Figure 8. Experimental groups treated with the molecular scaffold one at 10 J/cm2 indicate the structural damages induced by PDT, in which increasing damage in a dose dependent manner. In (a–e), no significant changes induced by therapy are seen. Starting from (f), signs of cell damage are seen by shrinkage of cells and elongation, which may represent the onset of apoptosis. (k = L) show marked cellular damage with widespread vacuolization, and (n–o) show ultimate cell demise by presence of floating cells, dead cell clumping and monolayer disappearance. Note, however, that comparing the increase in morphological damage per PS concentration should be read horizontally, e.g., j, k and l are the same PS concentrations on the different scaffolds, hence showing different outcomes indicating that the DDS system by using AuNP alone is more efficacious and using both AuNP and mAb is even more efficacious.
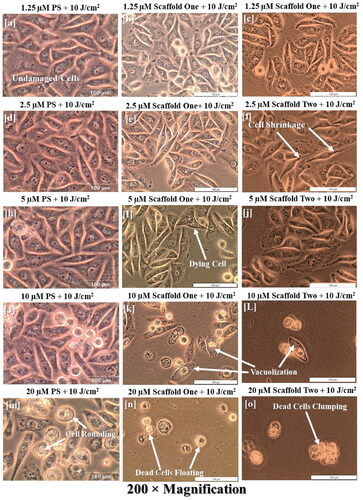
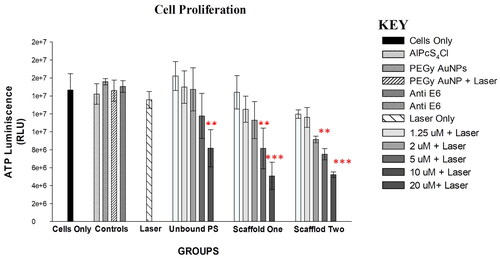
Figure 9. Post-irradiation ATP Luminescent signal of cells indicating significant decrease in proliferation of PDT treated cells (p < .01 as ** and p < .001 as ***) after 24 h. Control cells and groups treated with either of the variables alone did not show significant decrease in cell proliferation.
Supplemental Material
Download MS Word (92.4 KB)Data availability statement
The authors confirm that the data supporting the results are available in this article. Additional data are available from the corresponding author, upon reasonable request.