
Figures & data
Figure 1. Ligand exchange method, in which the AlPcS4Cl sulphate (S) groups Bind onto PEGylated AuNP polymer chains.
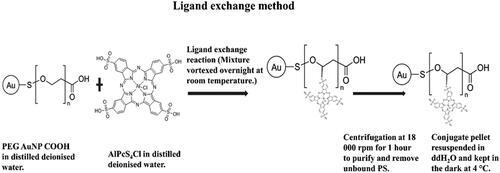
Table 1. Excitation and emission parameters for fluorescence microscopy and flowcytometry.
Figure 2. Ultraviolet–Visible spectroscopy (UV‐Vis) of AuNPs, AlPcS4Cl and AlPcS4Cl‐AuNP dispersed in ddH2O, read at the spectral region between 400 and 800 nm. The absorption peaks are at 675 nm for AlPcS4Cl and 520 nm for PEG‐AuNP‐COOH. Post conjugation, ALPcS4Cl‐PEG‐AuNP‐COOH indicates absorption peaks at 525 nm and 675 nm.
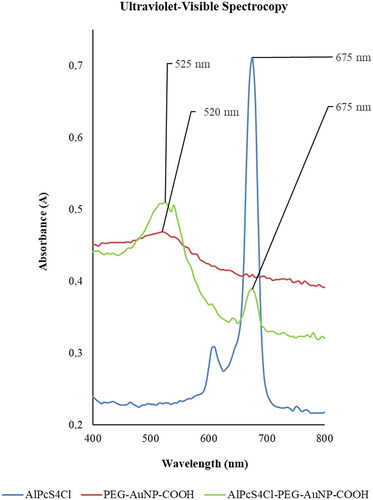
Figure 3. Graphical representation of FTIR spectrum for PEG-AuNP-COOH, AlPcS4Cl, and AlPcS4Cl–PEG-AuNP-COOH conjugate.
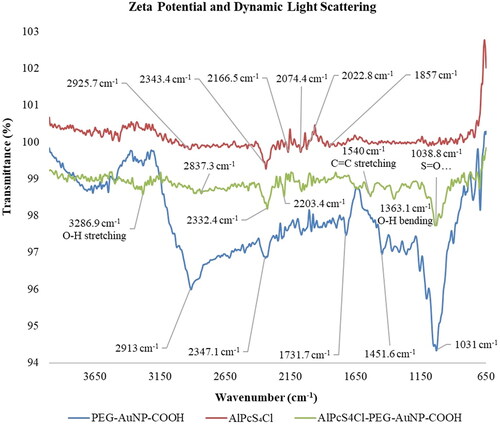
Table 2. DLS, Zeta potential and PDL Characterisation.
Table 3. Mean and standard deviation significance breakdown of Annexin V/PI outcomes.
Figure 4. Annexin V/PI Cell death Analysis in Isolated A375 CSCs following PDT: the cells that received no treatment served as the control. The illustration clearly shows triggering of early apoptosis in A375 and CSCs. When compared to non-irradiated groups, this cell death mechanism enhanced in PS-AuNP conjugate groups irradiated with a laser at 673.2 nm with a fluency of 5 J/cm2 (laser irradiation at 10.40 s, calculated using a power output of 75mW semiconductor diode laser).
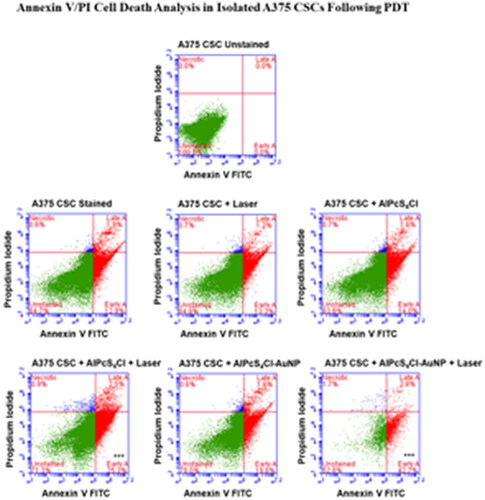
Figure 5. 200x magnification Immunofluorescence microscopy of A375 CSCs expressing caspase 3 apoptotic proteins indirectly labelled with FITC (green) and counterstained with DAPI. (blue). untreated CSCs designated as a negative control, displaying no expression. Caspase 3 expression, on the other hand, is abundantly visible in the PS-AuNP conjugate + laser treated A375 and CSC groups.
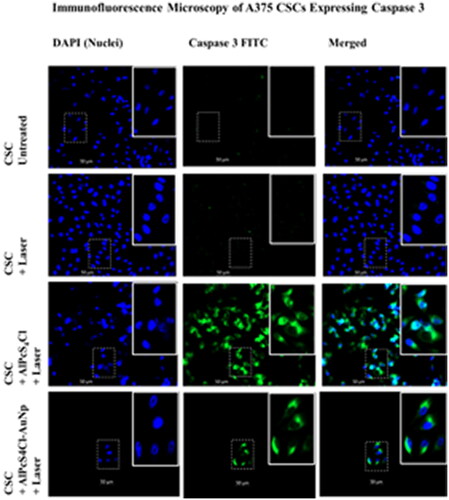
Figure 6. 200x magnification Immunofluorescence microscopy of A375 CSCs expressing p53 apoptotic proteins indirectly labelled with FITC (green) and counterstained with DAPI (blue). untreated CSCs designated as a negative control, displaying no expression. PS-AuNP conjugate + laser treated A375 and CSC groups show p53 expression.
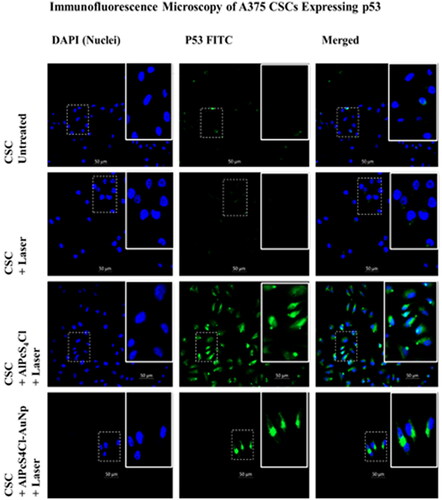
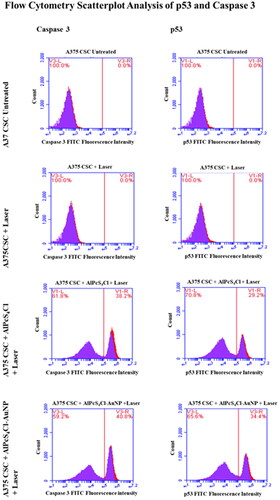
Figure 7. Post AlPcS4Cl and AlPcS4Cl-AuNP PDT, flow cytometry scatterplot analysis of p53 and caspase 3 apoptotic proteins on A375 total cell population and A375 CSC subpopulation. In AlPcS4Cl-AuNP PDT groups, both apoptotic proteins were found to be overexpressed.
Data availability statement
The authors confirm that the data supporting the results are available in this article. Additional data are available from the corresponding author, upon reasonable request.