Figures & data
Figure 1. Preparation of LZO porous ceramics by the replica method.
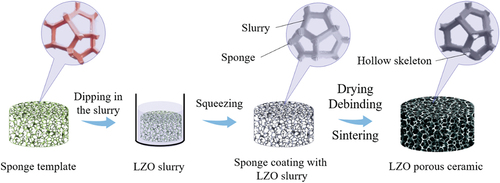
Figure 2. (a) The function of viscosity with rotation speed with different dispersant contents; (b) contact angle of slurry with different water to alcohol ratio; (c) shear rate-viscosity curve of slurry with different water to alcohol ratio.
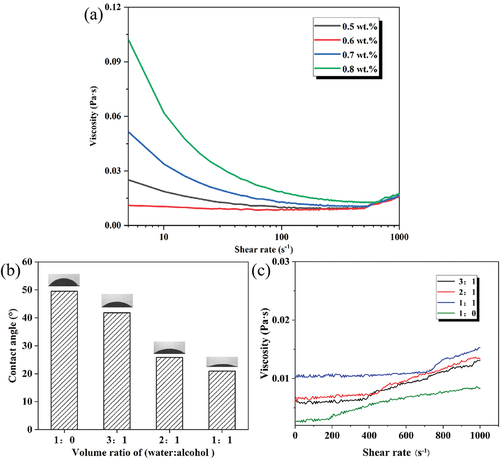
Figure 3. SEM images of green body by the replica method (sample with coating content of 10.5): (a) polyurethane foam template, (b-d) SEM images of dry green body.
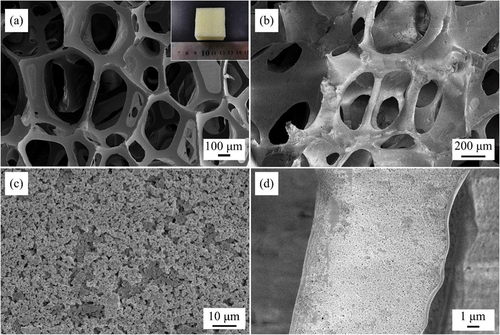
Figure 4. TG-DSC curve of dry green body (sample with coating content of 10.5).
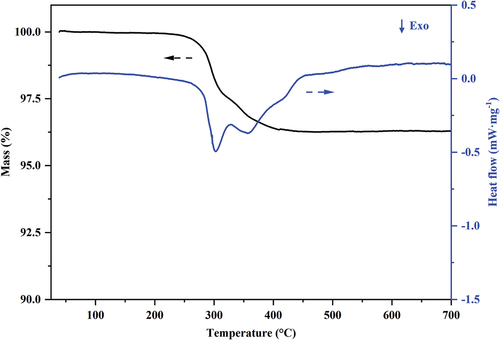
Figure 5. SEM images of LZO porous ceramics with different coating contents (100×): (a) 13.7, (b) 10.5, (c) 6.4, (d) 4.6, (e) The micro-CT of LZO porous ceramics (sample with coating content of 10.5).
Figure 6. SEM images of skeleton structure of LZO porous ceramics with different coating contents (1000×): (a) 13.7, (b) 10.5, (c) 6.4, (d) 4.6.
Figure 7. Pore size distribution of LZO porous ceramics with different coating contents: (a) 13.7, (b) 10.5, (c) 6.4, (d) 4.6.
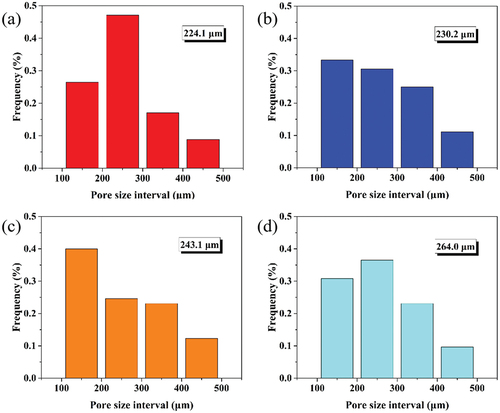
Figure 8. Density and porosity of LZO porous ceramics with different coating contents.
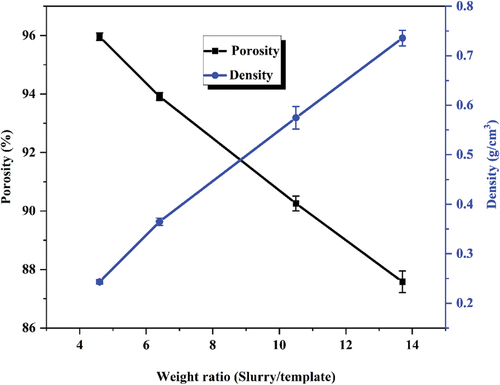
Figure 9. Compressive strength and thermal conductivity at room temperature of LZO porous ceramics with different coating contents.
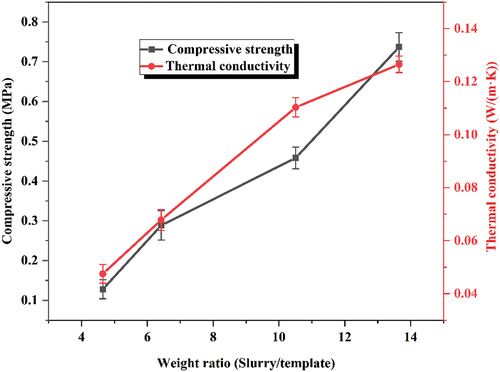
Figure 10. Thermal conductivity and porosity of various typical porous ceramics.
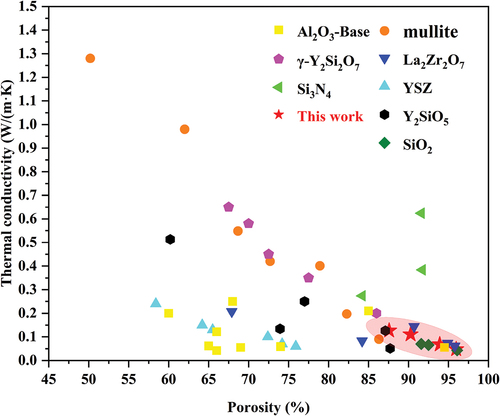
Figure 11. Cold-side temperature of LZO porous ceramics (sample with coating content of 4.6, 1 cm thickness).
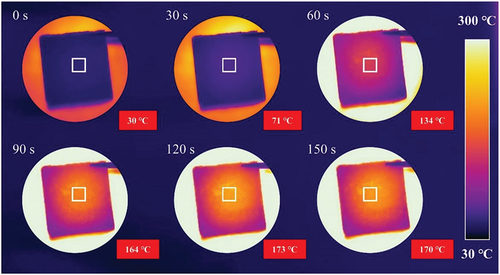
Figure 12. Cold-side temperature of LZO porous ceramics during the heating and cooling process.
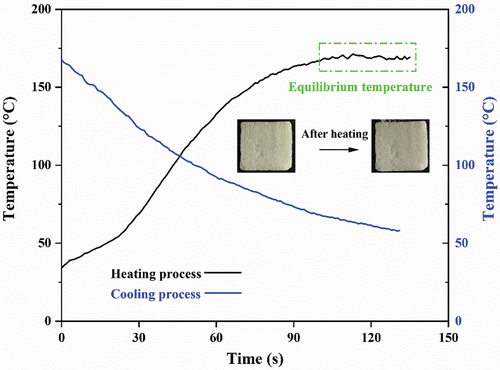
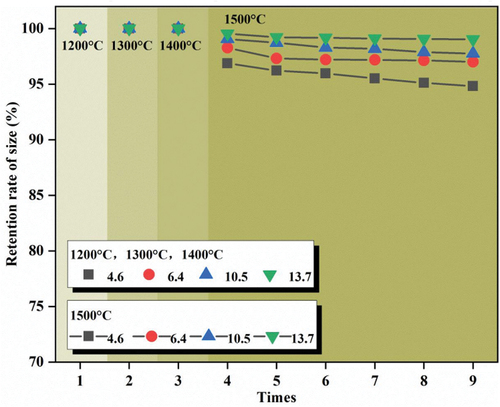
Figure 13. Size retention rate of LZO porous ceramics after heat treatment.