
Figures & data
Figure 1. Biofilm formation capacity of seven P. aeruginosa strains as quantified by impedance-based measurements in xCELLigence (a) and by Crystal Violet (CV) staining (b, c). Panel b represents the absorbance of released CV at 0, 8, 24, 36, 56 and 72 h, where higher absorbance indicates larger biofilm growth. Panel c depicts biofilm formation in ibiTreat 96-well plates at 36 h, where more intense colour reflects larger biofilm mass. Bacterial strains used in the experiment are indicated in the legend and include a mutant of PAO1 strain with impaired biofilm formation. Data are the means of three biological replicates.
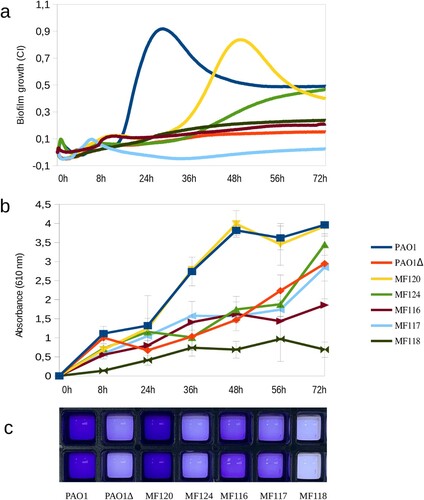
Figure 2. Effect of ciprofloxacin (CIP), tobramycin (TOB), ceftazidime (CAZ), colistin (CST), piperacillin-tazobactam (TZP), imipenem (IPM) and meropenem (MEM) on P. aeruginosa PaO1wt and MF120 biofilm formation. Graphs show estimates of total biofilm mass as measured at 37°C using impedance-based measurements. Black lines indicate untreated controls. Each line represents the mean of three biological replicates. All antibiotics were added at the beginning of the experiment together with bacterial inoculum from 0.625 to 32 mg/L for all antibiotics except TPZ (0.625 to 128 mg/L). SDs are not shown for clarity.
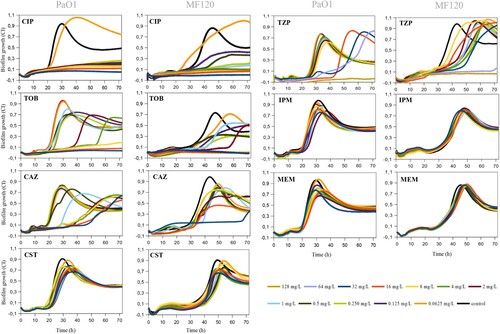
Table 1. Minimum inhibitory concentration (MIC) vs minimum biofilm inhibitory concentration (MBIC) values for ciprofloxacin (CIP), tobramycin (TOB), ceftazidime (CAZ), colistin (CST), piperacillin-tazobactam (TZP), imipenem (IPM), and meropenem (MEM) in different P. aeruginosa strains.
Figure 3. Effect of piperacillin-tazobactam (TPZ), ceftazidime (CAZ), ciprofloxacin (CIP) and tobramycin (TOB) on mature biofilms of PaO1 (24 h after inoculation) and MF120 (48 h) strains. After the addition of the antibiotics, biofilm growth was observed for additional 100 h. Black lines represent antibiotic-free controls while black arrows indicate the time when antibiotics were added. Each line represents the mean of three replicates. The emergence of dormant, persister cells, which appeared after the biofilm eradication using different antibiotics, is marked by black asterisks.
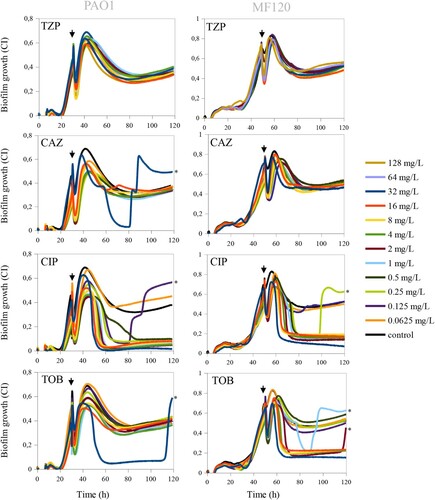
Figure 4. Mannitol effect alone and in combination with ciprofloxacin in the eradication of persistent P. aeruginosa MF120 cells. (a) Biofilm growth when mannitol was added at the beginning of the experiment, and ciprofloxacin added at 48 h (vertical arrow). Panel (b) corresponds to a second experiment where both mannitol and CIP were added together at 48 h (vertical arrow), reaching final concentrations of 3200–16 mg/L for mannitol and 0.25 mg/L for CIP. Panel (c) represents bacterial cell viability after treatment with different combinations of mannitol and CIP. Data show the average of log CFUs counts from three biological replicates. Statistical significance was assessed by t-test at 140 h; asterisks indicate p ≤ 0.001, ns–not significant. M–mannitol; CIP–ciprofloxacin (0.25 mg/L).
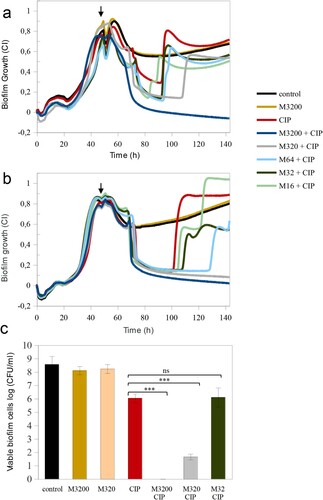
Figure 5. Persister regrowth assay. (a) Phenotypical differences between persister cells (treated with ciprofloxacin [CIP] 0.25 mg/L) and control cells. Clear differences in pigment colouration are observed. In order to maintain persisters phenotype, MF120 cells treated with CIP were subcultured in LBA plates supplemented with CIP, while controls were continuously cultured in LBA plates without antibiotics. (b) Persister regrowth and reversion into actively growing cells in fresh LB media supplemented with mannitol (3200 mg/L) or LB alone at 72 and 96 h, respectively. Three biological replicates and negative controls for each condition were included in the experiment. Pigment reversion phenotypes are observed with time in persister cells, and the reversion is accelerated in the presence of mannitol. The genomes of control and persister cells were fully sequenced and the observed mutations are described in .
![Figure 5. Persister regrowth assay. (a) Phenotypical differences between persister cells (treated with ciprofloxacin [CIP] 0.25 mg/L) and control cells. Clear differences in pigment colouration are observed. In order to maintain persisters phenotype, MF120 cells treated with CIP were subcultured in LBA plates supplemented with CIP, while controls were continuously cultured in LBA plates without antibiotics. (b) Persister regrowth and reversion into actively growing cells in fresh LB media supplemented with mannitol (3200 mg/L) or LB alone at 72 and 96 h, respectively. Three biological replicates and negative controls for each condition were included in the experiment. Pigment reversion phenotypes are observed with time in persister cells, and the reversion is accelerated in the presence of mannitol. The genomes of control and persister cells were fully sequenced and the observed mutations are described in Table 2.](/cms/asset/145124d4-f5ac-42e1-a523-b583d8392496/temi_a_1994355_f0005_oc.jpg)
Table 2. Single Nucleotide Polymorphisms (SNPs) detected in P. aeruginosa control and persister variants.
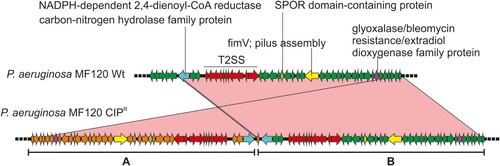
Figure 6. Genomic duplication in the P. aeruginosa CIPR variant. The wild-type strain (wt) and the persister colony from a CIP-treated plate were sequenced and compared (using blastn). A region spanning 42 genes was found duplicated and inverted in the CIPR variant. This is marked as A whereas the original sequence is shown as B. Relevant genes are coloured differently and their names indicated. The sequence identity of the alignment was 100% for all genes. T2SS, type 2 secretion system.
Editable_Supplementary_Material_Ziemyte_et_al.docx
Download MS Word (882.4 KB)Data availability
The data that support the findings of this study are available from the corresponding author upon reasonable request.